- DevOps - Home
- DevOps - Traditional SDLC
- DevOps - History
- DevOps - Architecture
- DevOps - Lifecycle
- DevOps - Tools
- DevOps - Automation
- DevOps - Workflow
- DevOps - Pipeline
- DevOps - Benefits
- DevOps - Use Cases
- DevOps - Stakeholders
- DevOps - Certifications
- DevOps - Essential Skills
- DevOps - Job Opportunities
- DevOps - Agile
- DevOps - Lean Principles
- DevOps - AWS Solutions
- DevOps - Azure Solutions
- DevOps Lifecycle
- DevOps - Continuous Development
- DevOps - Continuous Integration
- DevOps - Continuous Testing
- DevOps - Continue Delivery
- DevOps - Continuous Deployment
- DevOps - Continuous Monitoring
- DevOps - Continuous Improvement
- DevOps Infrastructure
- DevOps - Infrastructure
- DevOps - Git
- DevOps - Docker
- DevOps - Selenium
- DevOps - Jenkins
- DevOps - Puppet
- DevOps - Ansible
- DevOps - Kubernetes
- DevOps - Jira
- DevOps - ELK
- DevOps - Terraform
DevOps - Quick Guide
DevOps - Traditional SDLC
Today, we see that companies are always trying to be more efficient. They want teams to work together better and release software faster. This is where DevOps comes in. It connects the software development and operations teams so they can do things like continuous integration and delivery. DevOps is not just about using tools, it's more like a way of working. It helps everyone share responsibility and work together.
But before DevOps, we used the Traditional Software Development Lifecycle (SDLC) for building software. In traditional SDLC, we follow a step-by-step process. First, we gather requirements, then we design, develop, test, and finally deploy and maintain the software. This process works in some cases, but it can be slow and not flexible enough for today’s fast-paced needs.
In this chapter, we will look at why the old SDLC method has problems. Then we will see how DevOps solves these issues. It gives us a more flexible and team-based way to develop software. We will also compare traditional SDLC with DevOps to understand why more teams are choosing DevOps today.
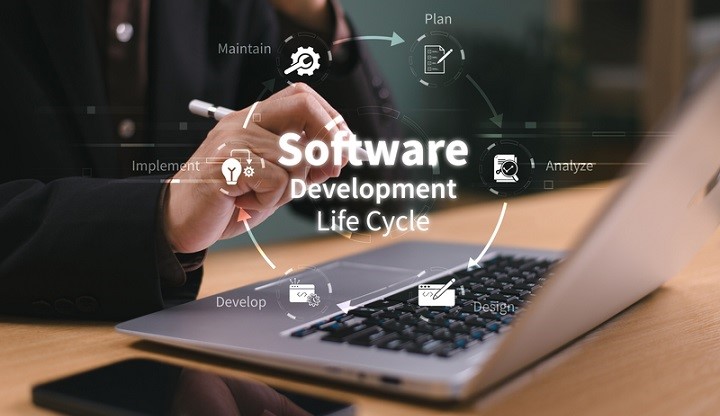
Traditional SDLC Phases
The Traditional Software Development Lifecycle (SDLC) uses a step-by-step process. It's also called the "waterfall model." Each phase happens one after the other. We can't start the next phase until we finish the previous one. The following image shows a simple breakdown of the key phases in traditional SDLC −
Requirements Gathering and Analysis
In this first phase, we focus on understanding what the project needs. Business analysts, stakeholders, and customers work together to collect all the details about what the software must do. The goal is to make sure everyone understands what the system should achieve.
We document all these needs in a Software Requirements Specification (SRS). This document is very important because it helps guide the rest of the project. If we miss something or misunderstand the requirements, it can cause big problems later.
Design Phase
After we know what we need, we move to the Design phase. Here, software architects and designers create the plan for the software. This includes how different parts of the system will work together (high-level design) and the details of each part (low-level design).
We also decide on database structure, user interface (UI), and which tech stack we will use. The result of this phase is a design document. Developers use this document as a guide when they start building the software.
Development Phase
Next, we enter the Development phase. Here, developers write the code based on the design document. They create different parts or modules of the software. This phase takes the most time because developers need to write, debug, and test the code.
Usually, different people or teams work on different parts. Sometimes, when these parts come together, there can be delays.
Testing Phase
After development, we start the Testing phase. The quality assurance (QA) team checks the software to find bugs or errors. They also make sure the software matches the original requirements. We run many types of tests like unit testing, integration testing, system testing, and user acceptance testing (UAT).
The testing phase is important for ensuring the product works well. In traditional SDLC, we do this after building the whole system, which makes fixing problems harder and slower.
Deployment Phase
When the software passes all tests, it is ready for the Deployment phase. We move the system to the production environment where users can start using it. In traditional SDLC, this often involves manual steps, which can cause delays or mistakes, especially for big systems. Once deployed, we keep an eye on the software to make sure it works as expected.
Maintenance Phase
After deployment, we enter the Maintenance phase. This involves fixing any bugs, making updates, and adding new features if needed. Maintenance can be of three types:
- Corrective − Fixing bugs
- Adaptive − Adjusting to changes in environment
- Perfective − Improving or optimizing the system
The traditional SDLC often finds this phase hard. It can be slow and costly to make changes because of the rigid, step-by-step nature of the process.
Challenges in Traditional SDLC
While Traditional Software Development Lifecycle (SDLC) worked well for many projects, it has some problems in today's fast-moving world. These problems mostly come from its stepbystep process and the lack of teamwork between development and operations teams.
Let's look at the main challenges in the traditional SDLC:
Siloed Teams
Development, testing, and operations teams do not work together. There is no clear communication between them. When an issue needs more than one team, it causes delays and slows the work.
Long Development Cycles
The step-by-step process makes projects take longer. We must finish one phase before we start the next. It takes time to respond to changes or new needs because feedback comes late.
Manual Processes
Testing, deploying, and even some development tasks are done by hand, which implies more human mistakes. Doing things manually slows down the project and makes updates less frequent.
Frequent Errors
We find bugs late because we don't integrate and test early. Fixing these problems late in the project takes time and costs more. Development teams don't get fast feedback from the testing stage.
Difficulty in Adapting to Change
The step-by-step process makes it hard to add new features or change things once we start development. If customer needs or market trends change, we might have to start the process again. This leads to delays and extra costs.
Due to these challenges, many companies now prefer DevOps. DevOps is faster, more flexible, and helps teams work together better.
How DevOps Solves the Challenges of Traditional SDLC?
DevOps helps fix many problems that we see in the traditional SDLC. It focuses more on teamwork, automating tasks, and delivering updates regularly. Here’s how DevOps solves the common problems we face with the old SDLC method:
DevOps Breaks Down Silos
DevOps brings together development, operations, and QA teams. Teams work together from the start. This means, better communication and shared work. We see fewer delays, and problems get fixed faster.
Enables Shorter Development Cycles
DevOps uses continuous integration (CI) and continuous delivery (CD). This helps us build and test features more often. Updates are delivered in smaller, more frequent parts. It gives us faster feedback and lets us release new versions more quickly.
Automates Processes
Automation is key in DevOps. It covers testing, deployment, and even managing infrastructure. We use automated tests and pipelines, so we don't have to do many things by hand. This makes fewer mistakes and speeds up work.
With tools like Infrastructure as Code (IaC), we can set up and manage infrastructure automatically. It helps us grow and maintain systems easily.
Reduces Errors
With automated testing and continuous integration, we catch problems early. Because we keep testing and integrating code often, bugs don't stay around for long. We fix them before they become big issues.
We also use monitoring tools to keep an eye on the system, which helps us fix problems before users notice them.
Adapts to Change Easily
DevOps is flexible. It helps us adjust quickly when new requirements or customer needs pop up. With continuous delivery, we can add small changes, test them, and release them fast. We don't need to restart the whole process. This makes it easier to stay updated with market trends and customer feedback.
In short, DevOps changes how we develop software. It focuses on automation, teamwork, and constant improvement. This helps us finish projects faster, make fewer mistakes, and adjust to changes better.
Traditional SDLC vs DevOps
The following table highlights how Traditional SDLC differs from DevOps −
| Aspect | Traditional SDLC | DevOps |
|---|---|---|
| Team Structure | Siloed teams (development, QA, operations work separately). | Cross-functional teams work together collaboratively. |
| Development Cycle | Sequential (waterfall) model; long development cycles. | Continuous development and delivery in small, frequent increments. |
| Testing Approach | Testing occurs at the end of the development phase. | Continuous testing throughout the development process (CI/CD). |
| Automation | Limited automation, with a focus on manual processes. | Heavy emphasis on automation for testing, deployment, and infrastructure. |
| Feedback Loops | Slow feedback; issues are identified late in the cycle. | Fast feedback loops through continuous integration and monitoring. |
| Deployment Frequency | Infrequent, often large, batch releases. | Frequent, small, and incremental releases. |
| Adaptability to Change | Rigid and less adaptable to changes once the process has started. | Agile and easily adaptable to changing requirements or market trends. |
| Error Detection | Errors are often detected late, making them costly to fix. | Early error detection through continuous integration and automated testing. |
| Collaboration | Teams operate independently with minimal collaboration. | Development, QA, and operations collaborate closely from start to finish. |
| Infrastructure Management | Manual provisioning and management of infrastructure. | Infrastructure as Code (IaC) automates infrastructure provisioning and management. |
| Release Time | Longer release times due to extensive manual testing and deployment. | Faster release times with automated pipelines and continuous deployment. |
| Responsibility | Separate responsibilities for development and operations. | Shared responsibility among all teams for development, testing, and operations. |
This comparison highlights how DevOps overcomes the limitations of traditional SDLC by encouraging collaboration, automation, and flexibility, leading to faster, more efficient software delivery.
Conclusion
In this chapter, we looked at the traditional Software Development Lifecycle (SDLC). We highlighted the problems it has. Then we explored how DevOps helps fix these issues.
The move from a strict process to a flexible way of working makes things better. It helps us catch errors early and test more often. This way, we can improve product quality. In the end, using DevOps changes software development. It makes the process faster and more responsive. This leads to better results in our fast-changing tech world.
DevOps - History
DevOps aims to make software delivery and operations better and faster. In this chapter, we will look at the history of DevOps. We will see how it started from early software development practices to become a key part of modern IT and software engineering.
We will look at the different phases that helped shape DevOps. We will talk about how DevOps practices began, the important milestones in its history, and how these changes have changed the way organizations deliver software.
Historical Context
Software development has changed a lot over time. At first, we used traditional SDLC which gave a step-by-step way to develop software. It worked well when projects were simple and predictable.
But as software got more complex, this old model didn't work so well. We needed faster results, better teamwork, and flexibility. So, new ways like Agile and later DevOps came to help solve these problems.
The Rise of Agile Development
In the early 2000s, the Agile Manifesto changed how we think about software development. Agile brought ideas that focus on being flexible, working closely with the customer, and making progress bit by bit.
Unlike traditional SDLC, Agile methods like Scrum and Kanban let teams get feedback and make improvements during the project, not after. This helped us adjust to changes quickly. Agile also helped prepare the way for DevOps, which improved teamwork and automation even more.
The Growing Complexity of Software Systems
As businesses started to depend more on software, things got a lot more complex. We had to deal with cloud computing, microservices, and distributed systems. This made us think differently about how we develop, deploy, and manage software.
Software now has many connected parts that need frequent updates. Scaling apps to handle more users became difficult with old methods.
There was a bigger need for quick delivery of new features for mobile and web apps. Competition worldwide made us deliver faster and more reliable software.
The Challenges of Traditional SDLC
Traditional SDLC worked well when projects were small and simple. But it had trouble keeping up with modern software development needs.
- Not flexible − Once development starts, it's hard to make changes.
- Slow feedback − It takes a long time to catch problems, because testing happens much later.
- Siloed teams − Developers, testers, and operations don't talk to each other enough, which causes communication problems.
- Manual work − Things like testing, deployment, and managing infrastructure are done manually, leading to more mistakes.
- Difficult to handle changes − When requirements change, it's costly and sometimes needs us to start projects over.
These problems showed us that we needed methods that are more flexible, promote better teamwork, and use more automation. This led to the rise of DevOps.
The Emergence of DevOps
In the late 2000s, we saw the rise of DevOps. It came because we needed to deliver software faster and better. There was a big gap between the development and operations teams. This often slowed down projects in the traditional SDLC.
With DevOps, we tried to bring these teams together. We used more automation and focused on continuous delivery. The main idea is to combine development, testing, and operations into one smooth process. This helped speed up software delivery and still keep quality high.
Early Adoptions of DevOps Practices
When DevOps started growing, many companies saw big improvements. Big names like Google, Netflix, and Amazon were quick to adopt DevOps. They used automation and CI pipelines to make their development faster.
We used automation to handle boring tasks like testing and deployment. This made things faster and with fewer mistakes. With Infrastructure as Code (IaC), teams could manage and set up infrastructure using code. It made scaling easier and environments more consistent.
CI/CD pipelines helped companies release updates more often and with more confidence. We also focused on monitoring and getting quick feedback. This helped us find and fix problems in production faster.
The Influence of DevOps Thought Leaders
DevOps also grew fast thanks to DevOps thought leaders. They shared their ideas through books, talks, and by leading the community.
- Gene Kim, who co-wrote The Phoenix Project and The DevOps Handbook, made DevOps popular. He told stories and did research to show how useful DevOps was for IT teams.
- Jez Humble, co-author of Continuous Delivery, helped many companies understand why CI/CD was important and how to use it.
- Patrick Debois is often called the person who came up with the term "DevOps." He helped organize early DevOps events and started DevOps Days.
- Nicole Forsgren, known for her work on the State of DevOps Report, gave us helpful data on how DevOps improves business performance.
These leaders shaped DevOps and gave us the best practices we still use today.
The Adoption of DevOps by Major Tech Companies
When big tech companies adopted DevOps, it showed how well it works on a large scale. Companies like Google, Amazon, and Netflix were some of the first to use DevOps. They used automation and continuous delivery to innovate faster and improve reliability.
- Google used DevOps ideas through its Site Reliability Engineering (SRE) It brings software engineering and operations together to keep services reliable.
- Amazon famously used DevOps to make its operations bigger. They moved from doing big releases to small, constant updates. This change helped Amazon meet huge demand while delivering new features faster.
- Netflix used DevOps to build a strong, scalable system. They used continuous delivery, microservices, and automation. They even made a tool called Chaos Monkey to test their system's strength, which became a famous part of their DevOps strategy.
These success stories from big companies made more businesses adopt DevOps. They showed that DevOps isn't just possible, it's necessary for modern software development.
Conclusion
In conclusion, we can say that DevOps has changed how development and operations teams work together. It fixed many problems in the old ways of working by bringing automation, continuous delivery, and a culture of shared responsibility. DevOps helps close the gap between these teams. It makes software delivery faster and more reliable. This improves both speed and quality.
As we look to the future, trends like AI, GitOps, and DevSecOps will make DevOps even better. These trends will help DevOps deal with the increasing complexity of modern software systems.
DevOps - Architecture
In todays fast-moving world of software development, we see that combining development and operations through DevOps architecture is very important for organizations. This method helps us work together better, makes processes simpler, and lets us deliver high-quality software quickly.
In this chapter, we will look at the basic parts of DevOps architecture. We will discuss its main principles, key parts, and the tools that help us use it. We will talk about how DevOps architecture allows practices like continuous integration and continuous delivery (CI/CD), infrastructure as code (IaC), and monitoring. All these help us create a more flexible and quick development environment.
What is DevOps Architecture?
DevOps architecture is a framework that mixes development and operations practices. It helps us create a smoother, more cooperative, and efficient way to deliver software. We focus on breaking down barriers between teams. We integrate different steps of the software development lifecycle (SDLC). This helps improve communication, automation, and constant improvement.
By using ideas from Agile and Lean methods, the DevOps architecture lets us react quickly to what the market needs. We can deliver new features faster and keep our software quality high.
Key Components of DevOps Architecture
Following are the key components of DevOps Architecture −
- Continuous Integration (CI) − CI is a practice where we automatically combine code changes from many contributors into a shared place several times a day. This process helps us find and fix problems early. It makes our software better.
- Continuous Delivery (CD) − CD builds on CI. It makes sure that the combined code is always ready to be used. This way, we can release new features and fixes quickly and reliably. It helps us get fast feedback and improve.
- Infrastructure as Code (IaC) − IaC is about managing and setting up our infrastructure through code. We dont do it by hand. This way, we can set up our infrastructure automatically, consistently, and repeatedly. It reduces mistakes and speeds up the process.
- Microservices Architecture − This design means breaking our applications into smaller services. These services are not tightly connected. We can develop, deploy, and scale them on their own. Microservices give us more flexibility. They let us work on different parts without stopping the whole system.
- Automation Tools − Automation is very important in DevOps architecture. We use tools like Jenkins, Ansible, and Terraform to automate tasks. These include testing, deployment, and managing setups. This lets our teams focus on more important work.
- Monitoring and Logging − We need to monitor our applications and infrastructure all the time. This is key to keeping our performance and reliability. Monitoring tools gather data and metrics. Logging tools collect detailed event information. This helps us find and fix issues quickly.
- Collaboration and Communication − Good teamwork between development and operations is key for DevOps architecture to work well. We use tools like Slack, Jira, and Confluence to help us communicate and manage projects. This way, everyone stays aligned and informed during the development process.
- Security (DevSecOps) − We add security into the DevOps process through DevSecOps. This makes sure security steps are part of every stage of development. This way, we can find problems early and stay compliant. We do this without slowing down our delivery.
Core Principles of DevOps Architecture
The core principles of DevOps architecture are very important for creating a team-focused and effective software development environment. These principles help to enhance teamwork and make processes easier. They also support continuous delivery and good monitoring with feedback.
Following these principles allows organizations to make their development workflows smoother. They can also improve software quality and respond faster to market demands. Here is a summary of the key principles of DevOps architecture −
| Principle | Description |
|---|---|
| Collaboration | Encourages open talks and teamwork. Development, operations, and stakeholders work together. This helps to share responsibility for quality and delivery. |
| Automation | Makes repeated tasks easier. Automation of code integration, testing, and deployment reduces mistakes. This increases overall efficiency. |
| CI / CD | Enables fast and safe software delivery. This is done by merging code changes into a central place often and automatically putting tested code into production. |
| Monitoring and Feedback Loops | Involves continuous monitoring of applications and infrastructure. This gives real-time information. Learning from failures and successes helps to improve all the time. |
DevOps Example Step By Step
To show how a typical DevOps workflow works, let's look at an example of an e-commerce app. This app wants to add a new feature. It wants to create a recommendation system for products. Here is how the DevOps process happens:
Step 1: Planning and Requirements Gathering
First, the development team works with stakeholders. They gather the needs for the recommendation system. They talk about what users expect, technical needs, and goals. This step is important to set up the next development work.
Step 2: Designing the Architecture
After gathering the needs, the team designs the architecture for the new feature. They choose a microservices architecture. This way, the recommendation system can run on its own and not depend on the main app. The design also includes how to store data and connect with current services.
Step 3: Development
Next, developers start coding the recommendation system. They break down tasks and assign them to different team members. They use version control systems like Git to manage code changes together. Each developer works on separate branches. This allows them to work at the same time without issues.
Step 4: Continuous Integration (CI)
When developers commit their code changes to the repository, a CI tool like Jenkins starts builds automatically. The CI process runs tests to check that the new code works well with the old code. If any tests fail, developers get alerts right away to fix the problems.
Step 5: Continuous Delivery (CD)
After the code passes all tests, it goes to the Continuous Delivery pipeline. This pipeline automates the deployment to staging environments for more testing. In this environment, more automated tests run. These include integration and performance tests to see how the feature works in different situations.
Step 6: Deployment
Once testing is successful in the staging environment, the recommendation system is ready to go live. Using tools like Ansible or Terraform, the team deploys the new feature to production. They watch the deployment closely to make sure it does not disturb existing services.
Step 7: Monitoring and Feedback
After the recommendation system is live, monitoring tools track its performance and user engagement. They collect metrics like response time, system load, and user interactions. Feedback from users helps check how effective the feature is and find ways to improve it.
Step 8: Continuous Improvement
Using the metrics and user feedback, the development team finds ways to make things better. They might see that the recommendation algorithms need improving or that new features could help user experience. This starts new planning sessions, and the cycle of development begins again. This keeps the app growing to meet user needs.
DevOps Toolchain
In our DevOps toolchain, we have many tools that help in different stages of software development. These tools help us work together, automate tasks, and be more efficient. This allows us to deliver good software quickly and reliably. When we use these tools together, we create a smooth workflow.
The following table provides a summary of the different types of tools we commonly use in DevOps −
| Tool Category | Tools | Description |
|---|---|---|
| Planning and Collaboration Tools | Jira | This tool helps us plan, track, and manage agile software projects. It has features for task assignments and tracking progress. |
| Trello | Trello is a visual tool. It uses boards, lists, and cards to help us organize tasks and projects. It makes it easy for teams to manage their work and priorities. | |
| Asana | Asana helps us create, assign, and track tasks. It makes communication better and shows how projects are going. | |
| Version Control | Git | Git tracks code changes. It allows many developers to work together on projects while keeping version history. |
| Bitbucket | Bitbucket is a web-based repository for version control. It supports Git and Mercurial. It has features for pull requests, code reviews, and integration with CI/CD tools. | |
| GitHub | GitHub is a platform for version control using Git. It offers collaborative features like pull requests and issue tracking. Many use it for open-source projects. | |
| CI / CD Tools | Jenkins | Jenkins is an open-source server. It helps us automate building, testing, and deploying applications. We can customize it with pipelines and plugins. |
| Travis CI | Travis CI is a cloud-based service that builds and tests code changes. It integrates directly with GitHub for easy deployment and teamwork. | |
| CircleCI | CircleCI is a platform that automates software testing and deployment. It gives quick feedback on code changes and supports Docker and Kubernetes. | |
| Configuration Management | Puppet | Puppet is an open-source tool. It helps manage and configure servers and applications. It keeps things consistent across environments. |
| Chef | Chef is a configuration management tool. It uses code to automate setting up and managing infrastructure. This helps us repeat and scale deployments easily. | |
| Ansible | Ansible is an open-source tool that makes configuration management easy. It uses a simple YAML language to help us update applications quickly. | |
| Monitoring and Logging | Prometheus | Prometheus is an open-source monitoring tool. It collects metrics and provides powerful ways to query data. It is built for reliability and scalability. |
| ELK Stack | The ELK Stack combines Elasticsearch, Logstash, and Kibana. It helps us with centralized logging and data analysis. We can visualize application health with it. | |
| Grafana | Grafana is an open-source platform for analytics and monitoring. It connects with different data sources. This allows us to create dashboards to see application metrics. |
Conclusion
In this chapter, we looked at its basic ideas, key parts, and how it has changed over time. We started by defining DevOps and why it is important today. We talked about core ideas like working together, automating tasks, and continuous integration and continuous deployment (CI/CD). These ideas help us use DevOps well. We also checked out the tools in the DevOps toolchain.
DevOps - Lifecycle
With a good DevOps strategy, we can improve our work, launch products faster, and make sure software is more reliable. In this chapter, we will go through the DevOps Lifecycle. We'll explain the stages like planning, development, deployment, and operations. We'll also see how getting feedback helps us improve every stage. Along the way, we'll share best practices for making the DevOps lifecycle work even better.
What is DevOps Lifecycle?
The DevOps Lifecycle is the ongoing process where we bring together development and operations work across the whole software delivery pipeline. It has stages like planning, development, deployment, operations, and feedback. These stages connect with each other. This helps us work better as a team, automate tasks, and make releases faster and more reliable.
Phases of DevOps Lifecycle
Having a clear DevOps lifecycle helps us deliver software smoothly and in a way that can grow with the needs. Following are the key phases of the DevOps Lifecycle −
- Planning and Design − We define the needs and plan the solution.
- Development − This is where we code, control versions, and run automated tests.
- Deployment − We use continuous integration and delivery. We also handle infrastructure as code.
- Operations − Here, we monitor, manage issues, and improve performance.
- Feedback − We make things better with regular feedback from metrics and users.
Phase 1: Planning and Design
The Planning and Design stage is the main base for good DevOps setup. It means understanding business goals, defining system needs, and designing infrastructure. Also, choosing right tools is important. This step makes sure our DevOps pipeline fits project's tech and operational needs.
Requirements Gathering
In this step, teams collect and write both functional and non-functional needs −
- Business requirements − What are the main goals?
- Technical requirements − What features or system links are needed?
- Security and compliance − What rules or security checks should we follow?
Solution Architecture
Here, we plan how the app will be built. Focus is on scaling and strength −
- Break the app into microservices or small parts.
- Plan how data moves between services and other systems.
- Find third-party services or APIs to link.
Infrastructure Design
This step shows how we will set up and manage the environment −
- Cloud vs on-premise − We choose where infrastructure will be (like AWS, Azure, or on-premise).
- Scalability − Make sure the system can grow with workload.
- Network design − Plan the network, security checks, and load balancing.
DevOps Tool Selection
Choosing right tools is key for making processes faster and simpler −
- Version control − Use tools like Git or SVN for code managing.
- CI/CD tools − Jenkins, CircleCI, or Travis CI help us with continuous integration and delivery.
- Infrastructure as Code − Tools like Terraform or Ansible automate environment setup and management.
Phase 2: Development
The Development phase is about writing, managing, and testing code in a simple and team-friendly way. We focus on automating stuff and catching problems early. This helps us deliver good code fast.
Code Development
Code development is writing and improving the app code based on the system plan −
- Break the tasks into smaller parts called sprints. It helps us finish things faster.
- Teams work together. We do code reviews and pair programming to keep code quality good.
- We follow coding rules and try to write code that can be used again.
Version Control
Version control systems help us track changes and work together without problems −
- Git, SVN − These are common tools to manage code versions.
- Branching strategies − We use methods like GitFlow or feature branching to separate different work.
- Collaboration − Many developers can work on the same project without creating issues.
Continuous Integration
Continuous integration (CI) makes sure code from different developers is added into one shared place −
- Automated builds − Tools like Jenkins, Travis CI, or CircleCI build the code automatically.
- Frequent integration − Developers add their code often to find issues early.
- Build verification − We make sure new code does not break the existing system.
Automated Testing
Automated testing helps us check if the code works well and reduces bugs −
- Unit Tests − We test small parts of the app one by one.
- Integration tests − We make sure different parts of the app work together fine.
- Test automation tools − Tools like Selenium, JUnit, or PyTest help us test things automatically.
Phase 3: Deployment
The Deployment stage is where we move code from development to the production environment. This stage is very important in the DevOps lifecycle. We use different tools and methods to make sure the code gets to users quickly and without many issues.
Continuous Delivery
In continuous delivery, we make sure code is always ready to go live. We test it automatically. After every change, we can deploy the code.
Our main goal is to deploy the code anytime. We can release changes to users more often. This helps us catch bugs early.
Infrastructure as Code
Infrastructure as Code (IaC) means we manage and set up infrastructure using code instead of doing it by hand. It makes it easy to create and manage servers, databases, and networks.
We write scripts to set up everything like servers and storage. We use tools like Terraform or Ansible to automate tasks. This saves us time and prevents mistakes.
Configuration Management
Configuration management helps us make sure all systems are set up the same way everywhere. It also keeps systems consistent over time.
We track all changes made to servers or systems. Tools like Chef, Puppet, and Ansible help us manage settings. This makes it easy to fix problems because we know what changed.
Deployment Pipelines
A deployment pipeline is a step-by-step process that code follows from development to production. It includes all stages like building, testing, and deploying.
We automate each stage to reduce the manual work. Developers push code to the pipeline, and the system does the rest. Pipelines help us deploy quickly and without errors.
Phase 4: Operations
In the Operations phase, we focus on keeping the application running smoothly. We monitor our systems and manage incidents. Our goal is to make sure everything works well and efficiently.
Monitoring and Logging
Monitoring and logging help us watch how the system performs. We track important metrics and logs to find issues quickly.
We use tools to check server health and performance. We collect logs to see what happens in the system. This helps us find problems before they affect users.
Incident Management
When something goes wrong, we need to handle it fast. Incident management is about fixing issues quickly and reducing downtime.
We have a process to report and respond to incidents. Team members know their jobs when an incident happens. We learn from each incident to prevent it in the future.
Capacity Planning
Capacity planning helps us decide how many resources we need for our applications. We make sure we have enough servers and storage for users.
We look at past usage to predict future needs. We adjust our resources to avoid slowdowns or crashes. This way, we can give a good experience for users.
Performance Optimization
Performance optimization is about making our applications run faster and better. We find ways to improve speed and efficiency.
We search for bottlenecks in the system and fix them. We test different setups to see what works best. Our goal is to keep users happy with fast response times.
Phase 5: Feedback and Improvement
In the Feedback and Improvement phase, we focus on learning from our processes and making them better. We want to improve our work and results by getting constant feedback and doing regular checks.
Continuous Feedback Loops
Continuous feedback loops help us gather input from users and team members regularly.
We ask for feedback after each deployment or big change. User insights help us see what works and what doesn't. We change our processes based on this feedback for better results.
Retrospective Meetings
Retrospective meetings are important for thinking about our work. We hold these meetings after each sprint or project. Team members share what went well and what we can improve. We create action items to fix issues in the next cycle.
Data-Driven Decision Making
Data-driven decision-making helps us make choices based on facts and numbers. We look at performance data to guide our actions. This way, we reduce guesswork and get better outcomes. We track key performance indicators (KPIs) to measure our success.
Iterative Development
Iterative development lets us improve our products bit by bit. We work in small cycles to release updates more often. Each cycle builds on the last one, improving features. This method helps us respond quickly to changes and user needs.
Conclusion
In this chapter, we looked at the key parts of the DevOps lifecycle. This includes planning, development, deployment, operations, feedback, and improvement. We talked about the importance of practices like automation, collaboration, and data-driven decision-making. These practices help us streamline processes and improve product quality.
When we use these practices, our teams can work better. We can respond fast to user needs and keep improving our workflows. Embracing the DevOps lifecycle helps us deliver high-quality software faster. This gives more value to users and makes our development process more successful.
DevOps - Tools
In this chapter, we will look at the different DevOps tools that teams use in various stages of the DevOps lifecycle. We will explore tools for version control, continuous integration, continuous delivery, infrastructure as code, and configuration management. We will also cover tools for monitoring, containerization, and cloud platforms. We will see what these tools do, how they help, and how they are set up to make the DevOps process better.
By the end of this chapter, you will have a good idea of the main tools that power DevOps and how they help in the success of software projects.
What are DevOps Tools?
DevOps tools are software that help us automate and manage different parts of the DevOps lifecycle. These tools let development and operations teams work together better. They help speed up how we deliver apps and make sure we keep the quality high. DevOps tools do many things. They help with version control, continuous integration, deployment, monitoring, and managing infrastructure.
DevOps tools cover everything from planning and development to deployment and monitoring. These tools make it easier to communicate and work together between teams. They automate tasks we do often, which lowers mistakes and saves time.
The Importance of DevOps Tools
DevOps tools are important because they make software development and delivery faster and more reliable. They help us handle complex systems while keeping deployments quick and stable. Without these tools, we would face slowdowns and more mistakes from doing things manually.
DevOps tools help us automate things like testing, deployment, and monitoring. They make it easier for teams to work together. We get continuous feedback, which means we can improve things faster. In addition, DevOps tools help keep our code quality high and reduce downtime when apps are running in production.
Top DevOps Tools
The following table highlights the top DevOps tools and their categories −
| Category of Tools | Tool Name | Features and Benefits | Use Cases |
|---|---|---|---|
| Version Control Systems | Git | Distributed version control Branching and merging support Tracks code changes efficiently |
Source code management Open-source project collaboration |
| SVN | Centralized version control Simple branching Strong security controls |
Centralized projects Teams needing strong admin control over repositories |
|
| Continuous Integration Tools | Jenkins | Open-source CI tool Wide plugin support Automated builds and testing |
Automating build pipelines Continuous integration for large projects |
| CircleCI | Cloud-based CI/CD tool Fast build execution Easy GitHub integration |
Fast, parallel builds Cloud-based projects with frequent deployments |
|
| Travis CI | Cloud-hosted CI/CD tool Pre-built environments GitHub integration |
Automated testing for open-source projects Simple deployment pipelines |
|
| Continuous Delivery Tools | Spinnaker | Multi-cloud continuous delivery Supports advanced deployment strategies |
Managing cloud-native applications Blue/green and canary deployments |
| GoCD | Pipeline as code Strong artifact management Easy rollback to previous versions |
Continuous delivery pipelines Configuring and visualizing complex workflows |
|
| Infrastructure as Code Tools | Terraform | Cloud-agnostic infrastructure Declarative configuration Manages dependencies automatically |
Infrastructure provisioning across multiple cloud providers Automating infrastructure |
| Ansible | Agentless architecture Simple YAML-based configuration Fast deployment of configurations |
Automated configuration management Application deployment and provisioning |
|
| Puppet | Model-driven configuration Centralized control Strong reporting features |
Managing complex infrastructures Automating system administration tasks |
|
| Configuration Management Tools | Chef | Code-driven infrastructure automation Strong testing framework Cloud integrations |
Automating server configuration Continuous deployment in multi-cloud environments |
| Ansible | Simple configuration management Push-based deployment Easy to use for beginners |
Rapid configuration of servers Ideal for lightweight automation |
|
| Puppet | Manages configurations in large environments Node-based reporting Scalable infrastructure |
Automating infrastructure at scale Continuous configuration management |
|
| Monitoring and Logging Tools | Prometheus | Time-series data monitoring Customizable alerting Strong Kubernetes support |
Monitoring cloud-native applications Tracking performance metrics and uptime |
| Grafana | Visualizes metrics Supports multiple data sources Customizable dashboards |
Real-time monitoring dashboards Graphing metrics for system performance |
|
| ELK Stack | Centralized logging Search and visualize log data Scalable log storage and processing |
Managing logs from large-scale applications Centralized log analysis and troubleshooting |
|
| Containerization Tools | Docker | Lightweight containers Easy container orchestration Portable across environments |
Running isolated apps in containers Building and shipping applications consistently |
| Kubernetes | Automated container orchestration Manages scaling and load balancing Self-healing features |
Orchestrating containers across clusters Scaling applications efficiently |
|
| Cloud Platforms | AWS | Extensive cloud services Global infrastructure Strong security features |
Hosting scalable web apps Data storage and processing |
| Azure | Hybrid cloud solutions Enterprise-grade security Integration with Microsoft products |
Hosting enterprise apps Hybrid cloud environments |
|
| GCP | Strong machine learning tools High-performance computing Cost-effective solutions |
Big data analytics Cloud-native app development |
Conclusion
In this chapter, we looked at different DevOps tools in important areas like version control, continuous integration, continuous delivery, infrastructure as code, configuration management, monitoring, and cloud platforms.
We talked about tools like Git, Jenkins, Terraform, Docker, and AWS. We explained their features, benefits, and how we can use them. These tools help us automate tasks, work together better, and make our teams more efficient. When we use these tools, it makes our workflows simpler, increases productivity, and helps deliver software faster and more reliably.
FAQs on DevOps Tools
In this section, we have collected a set of FAQs on DevOps Tools followed by their answers –
1. Which DevOps tool is best?
The "best" DevOps tool depends on what we need for our project. Some of the common ones are Jenkins for CI/CD, Git for version control, Docker for containers, Kubernetes for managing containers, and Ansible for configuration. When choosing, we should look at features, how well it scales, support from the community, and how it works with our current tools.
2. Is Jira a DevOps tool?
Jira is mostly used for project management and tracking issues. But we can connect it with other DevOps tools to help manage the full development process. While it's not exactly a core DevOps tool, it still helps us in planning, tracking, and coordinating the tasks in a DevOps setup.
3. Is DevOps a tool?
No, DevOps is not a single tool. It's more like a set of ideas and methods that help dev and ops teams work better together. It's about using different tools and technology to automate tasks and make the software development and delivery faster.
4. What is Jenkins used for?
Jenkins is mostly used for CI/CD. It helps automate the process of building, testing, and deploying software. We can connect it with version control systems, testing tools, and environments for deployment. This helps in setting up a smooth continuous delivery pipeline.
5. Is Docker a CI/CD tool?
Docker by itself is not a CI/CD tool, but it is a very important part of CI/CD pipelines. It helps us package apps and their dependencies in containers. This makes sure the environment is the same across development, testing, and production. CI/CD tools like Jenkins use Docker to build, test, and deploy apps that run in containers.
DevOps - Automation
In this chapter, we will look at the different sides of automation in DevOps. We'll start by explaining what automation means in DevOps. Then, we’ll talk about different types of automation and how they help us. We will cover topics like infrastructure automation, managing configurations, and continuous integration. Testing and monitoring automation will also be part of this.
In addition, we'll share some best practices to adopt automation, discuss the challenges we face, and consider security to keep the environment safe.
What is Automation in DevOps?
Automation in DevOps is the key part of modern software development. It helps us speed up our workflows, reduce mistakes, and make our systems more efficient. By automating tasks like code deployment, managing infrastructure, and testing, we can focus on more important things like improving the product and solving bigger problems.
DevOps automation lets us deliver software faster and with better quality. It also keeps things consistent and reliable in production.
Types of Automation
Automation in DevOps can be divided into several key types. Each type has its purpose and helps make our workflows smoother. By knowing these types, we can set up good automation strategies that fit our needs.
Infrastructure Automation
Infrastructure automation means we automate the setup, configuration, and management of servers, networks, and other parts of infrastructure. This helps us deploy resources quickly and in a consistent way.
- Configuration Management − Configuration management makes sure all systems in our infrastructure are set up correctly and stay that way over time. We use tools like Ansible, Puppet, and Chef for this.
- Infrastructure as Code (IaC) − IaC lets us manage infrastructure with code. We can version it and deploy it just like application code. This gives us more speed and flexibility. Here, we commonly use tools like Terraform and AWS CloudFormation.
Deployment Automation
Deployment automation makes the process of deploying applications to different environments easier. This helps us release faster and more reliably.
- Continuous Integration (CI) − Continuous Integration is when we automatically test and merge code changes into a shared repository. CI tools like Jenkins, Travis CI, and GitLab CI help with this.
- Continuous Delivery (CD) − Continuous Delivery builds on CI. It makes sure that code changes are ready for release to production. This helps us deliver new features faster.
Testing Automation
Testing automation helps us make the testing process more efficient and effective. This allows us to get feedback faster and improve software quality.
- Unit Testing − Unit testing checks individual parts of the application on their own. This makes sure each part works as it should.
- Integration Testing − Integration testing makes sure different modules or services work together correctly. This is important for spotting issues in how components interact.
- End-to-End Testing − End-to-end testing checks the whole application from start to finish. This makes sure the system works as expected in real-world situations. Key points include:
Monitoring and Logging Automation
Monitoring and logging automation helps us keep an eye on systems for performance and reliability. This lets us resolve issues before they get serious.
- Alerting − Alerting systems notify teams about problems or failures right away. This helps us respond quickly to potential issues.
- Analytics − Analytics automation involves gathering and analyzing data from applications and infrastructure. This gives us insights for better decisions.
Challenges and Best Practices of DevOps Automation
The following table highlights the challenges and best practices in DevOps automation −
| Category | Description |
|---|---|
| Best Practices for Automation | Start Small − We should begin with low-risk tasks. This helps us build confidence and get quick wins. |
| Incremental Adoption − We can gradually increase our automation efforts. This avoids overwhelming teams and makes the transition smoother. | |
| Measure and Improve − We need to keep an eye on automated processes. Collect feedback and use metrics to make our workflows better. | |
| Ensure Collaboration − We must encourage communication between development and operations teams. This helps align goals and share insights. | |
| Maintain Documentation − We should keep clear documentation of our automated processes. This makes it easier to understand and onboard new team members. | |
| Challenges and Considerations | Complexity − Automation can make things complicated. We need to manage it well and have clear documentation to avoid confusion. |
| Cost − The initial costs for automation tools and training can be high. We need to think about cost and benefits. | |
| Skills Gap − Teams might need new skills or training to use and manage automation tools well. | |
| Resistance to Change − Some team members may not want to adopt automation. They may fear losing their jobs or changing their workflows. | |
| Security Concerns − If we automate processes without proper security, we can make our systems vulnerable. |
Conclusion
In this chapter, we looked at the important role of automation in DevOps. We highlighted different types like infrastructure, deployment, testing, and monitoring automation. We talked about best practices for successful use. Starting small and encouraging teamwork are some of these practices. We also discussed challenges we face, like complexity and security concerns.
By using automation well, we can improve our productivity. We can make fewer mistakes and deliver high-quality software faster. This helps organizations respond quickly to market needs and stay competitive in a fast-changing tech world.
DevOps - Workflow
Read this chapter to learn about the DevOps Workflow. Here you will learn why it is important to have a clear workflow. We will also look at each step, from planning and coding to deployment and operations.
By the end of this chapter, you will understand how to create a DevOps workflow that improves how your team works together and boosts efficiency.
Step-by-Step DevOps Workflow
The first step in any DevOps workflow is planning and design. We need a strong base to make sure everything goes smoothly in development, testing, and deployment. For an e-commerce website, this part sets the path for the whole project.
Step 1: Define Project Goals and Objectives
We start by setting clear goals for the e-commerce platform. For example, give customers a smooth shopping experience, make sure it can handle high traffic during big promotions.
Step 2: Gather and Analyze Requirements
Next, we gather both business and technical needs:
- Business needs − Easy-to-use interface, safe payment methods, and fast checkout.
- Technical needs − Support different payment methods, link with inventory systems, and make sure it's mobile-friendly.
Step 3: Design the Solution Architecture
We design an architecture that's scalable and secure:
- Frontend − A web app using frameworks like React or Angular.
- Backend − Microservices built with Node.js, Python, or Java.
- Database − Choose SQL (like PostgreSQL) or NoSQL (like MongoDB).
- Cloud Infrastructure − Use AWS, GCP, or Azure for hosting and scaling.
Step 4: Select Appropriate DevOps Tools
We choose tools that match the project needs:
- Version Control − Use GitHub for managing code.
- CI/CD − Jenkins for setting up continuous integration and delivery.
- Infrastructure as Code (IaC) − Terraform to automatically manage cloud resources.
In the development phase of DevOps, we focus on writing and integrating code. This stage is important for making sure features like product catalog, shopping cart, and payment systems in an e-commerce website are developed smoothly. We use automation to reduce mistakes and make things faster.
Step 5: Develop Code Using Version Control
We use version control systems (VCS) like Git to manage code when working with a team. On the e-commerce platform, developers might work on different things like checkout process or product listing. Git lets them work together without messing up each other's changes.
- Branching − Developers make separate branches for each feature (like checkout-feature or search-bar-update). This way, they can work independently without breaking the main code.
- Merging − Once the feature is done and tested, we merge it back into the main
Step 6: Implement Continuous Integration Practices
Continuous Integration (CI) helps us keep the code clean and prevent big issues when merging code. Tools like Jenkins or CircleCI automatically build and test the code when developers push changes.
For example, when a new feature like "add-to-cart" is developed, CI makes sure it fits with the rest of the code without causing problems.
Step 7: Write Automated Tests
We write automated tests to catch bugs early and ensure our code works well. In an ecommerce site, tests might check things like product searches, adding items to the cart, or completing a purchase.
- Unit Tests − Test small parts of the code, like making sure the payment module calculates taxes right.
- Integration Tests − Check if different parts (like login and checkout) work well together.
- End-to-End (E2E) Tests − Simulate what users would do, like selecting a product, adding it to the cart, and checking out.
Step 8: Conduct Code Reviews
Code reviews help improve the quality of the code. Before we merge a new feature, like a product recommendation engine, a senior developer or peer checks the code to catch problems and ensure it follows best practices.
In DevOps workflow, the testing phase makes sure the platform is stable and works well. We focus on testing different parts of the e-commerce site to be sure it runs smooth and gives a good shopping experience to users.
Step 9: Execute Unit Tests
Unit tests check small pieces of code, like a function or component. In an e-commerce website, this might mean checking things like how it calculates total price or checks discount codes.
Make sure each part of the platform works as it should, by itself. For example, test the function that figures out shipping cost based on where the customer lives.
Step 10: Perform Integration Testing
Integration testing checks if different modules work well together. In an e-commerce site, this could be making sure the payment gateway and checkout process work fine, and that the inventory gets updated after someone buys something.
Ensure that different services (like payment and order management) work together without any problem. For example, test if inventory count goes down after an item is bought and the payment is done.
Step 11: Conduct System Testing
System testing checks the whole platform, not just parts of it. We test to see if everything works as it should in a real-world situation.
Test the complete system to make sure all features are working fine together. For example, simulate a user browsing the site, adding things to the cart, and buying them, checking for things like slow loading or payment errors.
Step 12: Conduct Acceptance Testing
Acceptance testing checks if the platform meets business needs and works for users. This is usually the last stage before the site goes live.
Make sure the system meets the goals of the business. For example, test if users can search for products, add them to the cart, and checkout without issues. We want to make sure the experience is good for users.
In the deployment phase, we get our e-commerce website ready for customers. This involves setting up resources, deploying the application, and making sure everything runs well. Let's break down the key steps.
Step 13: Use Infrastructure as Code to Provision Resources
We use infrastructure as code (IaC) to set up the servers and other resources we need for our e-commerce site. This way makes it easy to create and manage infrastructure without doing it by hand.
IaC helps us set up resources quickly and in the same way. We can easily copy our setup in different places, like development and production. We can use tools like Terraform or Ansible to define our infrastructure in code.
Step 14: Configure Environments
Next, we set up different environments for our e-commerce website. Each environment has a different job.
- Development − This is where we build and test new features.
- Staging − Here, we test the site with all the features together, just like it will be in production.
- Production − This is the live site where customers shop.
Configuring these environments well makes sure everything works as it should before going live.
Step 15: Deploy Applications
Once the environments are ready, we deploy our e-commerce application. This step moves the code and features to the production environment so users can use them.
We upload the code, set up databases, and check that all services are running. For example, when we launch a new payment gateway, we deploy it so customers can use it right away.
Step 16: Implement Continuous Delivery Pipelines
We use continuous delivery (CD) pipelines to automate the deployment process. This helps us release new features faster and with less risk.
Whenever we change the code, the CD pipeline automatically tests and deploys those changes. It means we can release updates for the e-commerce site, like new product features or bug fixes, quickly and reliably.
In the operations phase, we focus on keeping the e-commerce website running well. This means we monitor performance, manage issues, and make sure everything is secure and follows the rules.
Step 17: Monitor Application and Infrastructure Performance
We need to watch how well the e-commerce site is performing. This includes checking both the application and the infrastructure. Tools like Prometheus and Grafana help us track performance metrics, such as page load times, server health, and user activity. By monitoring these metrics, we can see any problems before they affect customers.
Step 18: Manage Incidents and Troubleshoot Issues
Even with our best efforts, issues can still happen. When they do, we must manage incidents quickly. For example, if users have trouble checking out, we need to act fast to find out what is wrong and fix it.
Step 19: Optimize Resource Utilization
We want to make the best use of our resources. This includes servers, databases, and storage. To optimize resource utilization, we:
- Scale Resources − We add or remove servers based on how much traffic we have. For example, during a sale, we may need more servers to handle the extra traffic.
- Review Costs − We check if we are spending too much on resources and look for ways to save.
This way, we keep the site running well without wasting money.
Step 20: Ensure Security and Compliance
Keeping the e-commerce site safe is very important. We must protect customer data and follow the rules. Here's how we do it:
- Regular Security Audits − We do audits to find and fix any weak points.
- Data Encryption − We use encryption to keep user data safe when they make transactions.
- Compliance Checks − We ensure the site meets rules like GDPR for protecting user data.
In the feedback and improvement phase, we focus on making our e-commerce website better based on what users say and the data we see. This helps us make sure we meet customer needs and always improve our processes.
Step 21: Gather Feedback from Stakeholders
We ask for feedback from everyone involved with the e-commerce site, including customers, team members, and business partners.
Step 22: Iterate on the Process Based on Feedback and Insights
We take feedback and data analysis and use them to change our processes. This means we make updates and improvements based on what we learn.
We often update our features, fix bugs, and make user experience better. For example, if the feedback shows that mobile users find it hard to navigate the site, we might redesign the mobile layout to make it easier to use.
Conclusion
In this chapter, we looked at the main phases of a DevOps workflow. These phases are planning and design, development, testing, deployment, operations, and feedback and improvement. We discussed all of this in the context of an e-commerce website.
DevOps - Pipeline
In this chapter, we will explain what DevOps pipelines are and why they are important. We will also look at the main parts of a DevOps pipeline. These parts include source code management, continuous integration (CI), continuous delivery (CD), deployment strategies, and feedback from monitoring. We will help you set up your DevOps pipeline.
What are DevOps Pipelines?
DevOps pipelines are processes that run automatically. They help us with continuous integration and continuous delivery (CI/CD) of software applications. These pipelines have a series of steps that code changes go through. This starts from the first development and goes to deployment in a production environment.
The main goal of a DevOps pipeline is to make the software development lifecycle smoother. This helps us deliver high-quality software faster and more reliably.
Key Components of a DevOps Pipeline
A DevOps pipeline has several key parts that work together. They help us make the software development and deployment process easier. Each part is important to make the pipeline work well and quickly.
Source Code Management
Source Code Management (SCM) systems help us track and manage changes to our code. They make sure we have version control and allow collaboration among developers.
Tools like Git, Subversion, Mercurial are used in source code management. The key functions include version control, branching and merging strategies, collaboration and code reviews
Continuous Integration (CI)
Continuous Integration automates how we add code changes into a shared place. It helps us ensure that new code merges smoothly and gets tested before we go to the next steps.
Continuous Delivery (CD)
Continuous Delivery builds on CI by automating how we deliver applications to testing and production environments. It makes sure that the code is always ready to be deployed.
Deployment
Deployment is when we move the application to a production environment. This is where endusers can use it. Good deployment strategies help us reduce downtime and keep things reliable.
Monitoring and Feedback
Monitoring tools help us keep an eye on application performance, user actions, and system health. Feedback is very important for finding problems early and keeping software quality high.
The key aspects of Monitoring and Feedback include real-time performance monitoring like latency and error rates, logging and alerting systems to catch issues early, and user feedback channels to collect ideas for future improvements.
How to Set Up a DevOps Pipeline?
Setting up a DevOps pipeline has several steps. These steps help us automate the software development lifecycle. Below is a guide to creating a DevOps pipeline with code examples.
Step 1: Set Up Your DevOps Environment
First, we need to choose our tools and technologies. Some popular choices for source code management are Git. For continuous integration and delivery, we can use Jenkins or Travis CI. For containerization, we often use Docker, and for orchestration, we choose Kubernetes.
After choosing our tools, we need to install the software on our local machine or server. To install Docker, we run −
sudo apt-get install docker-ce docker-ce-cli containerd.io
To install Jenkins on Ubuntu, we can use these commands −
sudo apt-get update
sudo apt-get install openjdk-11-jre
wget -q -O - https://pkg.jenkins.io/debian/jenkins.io.key | sudo apt-key add -
echo deb http://pkg.jenkins.io/debian-stable binary/ | sudo tee /etc/apt/sources.list.d/jenkins.list
sudo apt-get update
sudo apt-get install jenkins
Step 2: Create a Source Code Repository
Next, we create a source code repository. We start by making a Git repository for our project. We can do this by making a new directory and running git init. Heres how −
mkdir my-app
cd my-app
git init
It is also important to use good branching strategies. We can create branches for features, bug fixes, and releases with commands like git checkout -b feature/my-new-feature.
Step 3: Implement Continuous Integration
After setting up source code management, we implement continuous integration (CI). We start by configuring CI tools like Jenkins. We create a new Jenkins job for our project and connect it to our Git repository.
Next, we write build scripts to automate the build process. We might create a script called build.sh that has commands to build our application. Here's a simple example −
#!/bin/bash
echo "Building the project..."
# Add commands to build your application
We also need to add automated tests into our CI process to run unit and integration tests with each code commit. A Jenkins pipeline configuration could look like this −
pipeline {
   agent any
   stages {
      stage('Build') {
         steps {
            sh './build.sh'
         }
      }
      stage('Test') {
         steps {
            sh './run_tests.sh'
         }
      }
   }
}
Step 4: Implement Continuous Delivery
After continuous integration, we implement continuous delivery (CD). We set up deployment pipelines in Jenkins or other CI/CD tools to automate the deployment. For example, we can set up a Jenkins pipeline like this −
pipeline {
   agent any
   stages {
      stage('Deploy to Staging') {
         steps {
            sh './deploy_to_staging.sh'
         }
      }
      stage('Deploy to Production') {
         steps {
            input 'Approve Production Deployment?'
            sh './deploy_to_production.sh'
         }
      }
   }
}
We should also manage environment configurations well. We can use configuration files to handle different environments like development, staging, and production.
Step 5: Containerization and Orchestration
Containerization is a key step in a DevOps pipeline. We can use Docker to create a Dockerfile that defines our application’s environment. Here's a simple example of a Dockerfile −
FROM node:14
WORKDIR /app
COPY package*.json ./
RUN npm install
COPY . .
CMD ["npm", "start"]
After we create our Docker image, we manage our containers with Kubernetes. We can create a deployment manifest in YAML format, like deployment.yaml −
apiVersion: apps/v1
kind: Deployment
metadata:
  name: my-app
spec:
  replicas: 2
  selector:
    matchLabels:
      app: my-app
  template:
    metadata:
      labels:
        app: my-app
    spec:
      containers:
      - name: my-app
        image: my-app:latest
        ports:
        - containerPort: 3000
Step 6: Automate Deployment
For the deployment phase, we need to use good strategies like blue-green deployments, rolling updates, or canary releases based on our application needs. We can use Infrastructure as Code (IaC) tools like Terraform or Ansible to automate infrastructure. A simple Terraform script might look like this −
provider "aws" {
   region = "us-west-2"
}
resource "aws_instance" "app" {
   ami           = "ami-0c55b159cbfafe1f0"
   instance_type = "t2.micro"
}
Step 7: Monitoring and Logging
Lastly, we need to set up monitoring and logging to keep our applications healthy. We can use tools like Prometheus and Grafana to watch application performance and system health. For logging, we can use the ELK Stack, which has Elasticsearch, Logstash, and Kibana. A basic Logstash configuration might look like this −
input {
   file {
      path => "/var/log/my-app/*.log"
      start_position => "beginning"
   }
}
output {
   elasticsearch {
      hosts => ["http://localhost:9200"]
      index => "my-app-logs-%{+YYYY.MM.dd}"
   }
}
Conclusion
Setting up a DevOps pipeline means we choose the right tools. We configure our environments and automate processes for building, testing, and deploying applications. By following these steps and using the code examples, we can create a strong and effective DevOps pipeline for our projects.
FAQs of DevOps Pipeline
In this section, we have collected a set of FAQs on DevOps Pipeline followed by their answers –
1. What is a CI/CD pipeline in DevOps?
A CI/CD pipeline is a series of steps that happen automatically in software development and delivery. We have continuous integration (CI) where code changes get built, tested, and added to a shared repository. Then we have continuous delivery (CD) where the built and tested code gets sent to different environments. CI/CD pipelines help us improve software quality. They make delivery faster and let us release updates often.
2. What is a Jenkins pipeline?
A Jenkins pipeline is a set of steps in a CI/CD pipeline that we run in a specific order. We can define pipelines in Jenkins using a declarative way or scripted way. This gives us the chance to customize and be flexible. Jenkins pipelines can have steps for building, testing, deploying, and monitoring our applications.
3. Is Kubernetes a CI/CD tool?
Kubernetes is not a CI/CD tool by itself. But it is very important in many CI/CD pipelines. Kubernetes is a platform that helps us manage and scale containerized applications. It has features like deployment, scaling, and self-healing. This makes it great for automating how we deploy and manage applications in a CI/CD pipeline.
DevOps - Benefits
Read this chapter to learn why more and more companies are choosing DevOps to solve the issues they face with the traditional Software Development Life Cycle (SDLC). We will talk about how DevOps helps with faster software delivery, better quality, and improved teamwork. We will also see what kind of companies switch to DevOps and the problems it helps fix. Lastly, we will discuss why DevOps is now very important for modern businesses.
What are the Benefits of DevOps?
We see more and more companies switching to DevOps because it helps solve problems that come with the old way of doing things. They want to be faster, work together better, and release their software quicker. In today's fast market, where speed matters, DevOps has become a key strategy for companies.
DevOps helps fix problems like delays, poor communication between teams, and slow reaction times. Plus, it still keeps the software quality and reliability high.
Here are the benefits of moving towards DevOps −
1. Faster Time to Market
DevOps helps teams develop software faster, so companies can release new features, updates, or bug fixes quickly. For example, Amazon releases new code every 11.7 seconds using DevOps.
CI/CD pipelines help by automating builds, tests, and deployments, which cuts down on manual work and speeds up releases.
2. Better Collaboration and Communication
DevOps breaks the walls between development, operations, and testing teams. Everyone shares responsibility. Tools like Slack, Jira, and GitHub help teams communicate in real-time, making work easier and faster. This way, issues get solved faster, and productivity goes up.
3. Better Quality and Reliability
DevOps uses automated testing and monitoring, making sure that software is tested throughout the process. For example, Netflix uses "Chaos Engineering" to test its systems for any failure, improving its system’s reliability. Automation catches bugs early, so fewer problems make it to production.
4. More Frequent Deployments
Old development models only allow a few deployments each year. But DevOps allows multiple deployments daily or weekly, based on needs. Facebook, for example, uses DevOps for continuous deployment to deliver new features quickly. Automated workflows and testing make sure frequent releases are stable.
5. Scalability and Flexibility
DevOps works with cloud services like AWS, Google Cloud, and Azure. These platforms offer flexible infrastructures that grow with company needs. Infrastructure as Code (IaC) helps teams manage their infrastructure through code, which makes scaling easier.
6. Shorter Recovery Time
DevOps helps teams find and fix issues faster, cutting down the Mean Time to Recovery (MTTR). Etsy, for example, reduced its recovery time from an hour to just a few minutes using DevOps.
Monitoring tools like Prometheus and Grafana provide real-time information on system health, making it easier to catch and fix problems.
7. Security Improvements
DevOps introduces DevSecOps, bringing security practices into the development cycle early on. Automated security tests catch vulnerabilities before the software is released. For example, Google adds security checks in their CI/CD pipelines, ensuring all code is secure before production.
8. Cost Efficiency
DevOps cuts costs by automating repetitive tasks and reducing manual work. It also optimizes resources, especially with cloud infrastructure, lowering waste and improving cost management.
In the end, businesses adopt DevOps for faster releases, better teamwork, and more stable systems. With more companies using cloud computing, microservices, and containers, DevOps is now essential for staying ahead in today's tech world.
Challenges in Traditional SDLC
The following table highlights why it can be challenging to following Traditional SDLC methods in the new age of software development −
| Challenge | Description | Example |
|---|---|---|
| Lack of Flexibility | All requirements are fixed early, making changes harder later. | Changes in the middle of the project, like new market needs, are hard to add and cause delays. |
| Siloed Teams | Development, testing, and operations teams work separately, causing poor communication. | Developers may finish code without thinking about operations, leading to deployment problems. |
| Long Development Cycles | Since the process is step-by-step, it takes a long time to finish and launch the product. | New features may take months to release because of the fixed development, testing, and deployment. |
| Delayed Testing | Testing happens only at the end, which makes it risky as major issues are found late. | Bugs or issues are found late in the process, needing expensive fixes. |
| Hard to Change Things | Feedback or changes are tough to make and cost more because of the rigid, linear process. | Changing things during development means going back to earlier stages, slowing things down. |
| Limited Customer Feedback | Customers only see the product after it's done, delaying their feedback. | Users give feedback late, after the release, which could mean the features are not as expected. |
| Higher Costs | Issues found late and the fixed process make development and maintenance more expensive. | Fixing bugs or adding features after release costs more than doing it earlier. |
Types of Organizations Prefer Switching to DevOps
The following table highlights the type of organizations that prefer to transition from traditional SDLC to DevOps −
| Type of Organization | Why They Prefer Switching to DevOps | Example |
|---|---|---|
| Tech Startups | We need to quickly release features. We also want to change based on user feedback and stay flexible in a tough market. | Startups like Dropbox use DevOps to release updates often and grow fast. |
| E-commerce Companies | We require quick updates to websites and apps. This helps improve customer experience and manage high traffic. | Amazon uses DevOps to keep smooth updates and fix bugs fast. |
| Financial Institutions | We get faster software updates, better security, and help with rules and laws in the process. | Banks like Capital One use DevSecOps to automate checks for rules and security testing. |
| Healthcare Organizations | We need reliable systems, safe handling of patient data, and quick updates for important features. | Healthcare providers use DevOps to meet rules like HIPAA while providing updates. |
| Cloud-based Service Providers | We want systems that can grow and handle high demand easily. | Companies like Netflix and Google use DevOps for auto-scaling and resource management. |
| Telecom Companies | We must keep our systems running well and make network changes quickly to satisfy customers. | AT&T uses DevOps to improve service availability and add features fast. |
| Gaming Industry | We often release game updates, patches, and new content while keeping systems running well. | Game developers like EA and Blizzard use DevOps for quick updates and solving problems. |
| Media and Streaming Services | We need to deliver services smoothly and quickly add new features based on viewer demand. | Spotify uses DevOps to add new features fast and keep user experiences smooth. |
| Retail Chains with Digital Platforms | We want to manage high traffic during busy times like Black Friday and process payments safely and quickly. | Walmart uses DevOps to keep fast response times and system reliability during sales. |
| Logistics and Supply Chain Companies | We benefit from monitoring in real time and quicker software updates to manage inventory and deliveries. | UPS uses DevOps to improve logistics and track packages in real time. |
| Software-as-a-Service (SaaS) Providers | We require regular feature updates, automated deployments, and high system uptime to keep customers happy. | Salesforce uses DevOps to add new features without service interruptions. |
| Educational Platforms and EdTech | We benefit from regular improvements and safe handling of student data. Our systems need to grow with user numbers. | Coursera and Udemy use DevOps to update their platforms often and ensure they can scale. |
| Government Organizations | We need safe, reliable, and efficient software development to provide important services while following rules. | The UK governments GOV.UK platform uses DevOps to deliver new services quickly and securely. |
Conclusion
In this chapter, we looked at the benefits of using DevOps. We talked about the problems with traditional Software Development Life Cycle (SDLC) models. These issues make organizations want more flexible methods.
We also discussed the types of organizations that like to switch to DevOps. These include tech startups and financial institutions. They all use DevOps to become more efficient, safe, and quick to respond to market needs. By using DevOps practices, we can make our development processes smoother. We can help teams work better together.
DevOps - Use Cases
In this chapter, well learn about the use cases of DevOps. We'll see how these practices are used in real-world situations to solve common problems in software development and IT operations. Well look at basic DevOps cases like Continuous Integration and Continuous Deployment, along with advanced areas like microservices, security integration (DevSecOps), and monitoring for resilience.
By the end of this chapter, youll clearly understand the main DevOps use cases. You'll see the benefits they bring and the best ways to tackle challenges when applying DevOps in complex setups.
Common Use Cases of DevOps
The following table highlights some of the common use-cases of DevOps −
| Use Case | Description | Example | Applications | Tools Used |
|---|---|---|---|---|
| Continuous Integration (CI) | We automate code integration from many developers into one shared place. This includes building and testing code. | A team uses Jenkins to run tests automatically with every code change. This helps find bugs early. | Large software projects | Jenkins, Travis CI, CircleCI |
| Continuous Deployment (CD) and Delivery | We automate the process of releasing updates to production or staging environments. We focus on making this reliable. | A microservices setup where updates to services go to production automatically. | E-commerce platforms, SaaS products | Spinnaker, Argo CD, GitLab CI/CD |
| Infrastructure as Code (IaC) | We manage our infrastructure with code. This helps keep things consistent and makes it easy to set up resources. | Terraform scripts create cloud resources automatically when we need to scale. | Cloud environments, on-premise data centers | Terraform, AWS CloudFormation |
| Automated Testing and Quality Assurance | We use automated tests to check code changes. This helps us keep software quality high. | Selenium runs UI tests automatically with each deployment. This helps catch problems. | Web applications, mobile applications | Selenium, JUnit, TestNG |
| Microservices and Containerization | We break applications into smaller services. These services are in containers, making it easier to deploy them. | A company uses Docker and Kubernetes to move to microservices. This gives them more flexibility. | Scalable applications, APIs | Docker, Kubernetes, OpenShift |
| Monitoring and Observability | We gain insights into how our systems perform. This helps us troubleshoot better. | We use Prometheus and Grafana to monitor performance and set up alerts. | Production systems, cloud services | Prometheus, Grafana, ELK Stack |
| Security Integration (DevSecOps) | We put security practices into the CI/CD pipeline. This helps us find vulnerabilities and stay compliant. | We use SonarQube for automated security checks in a healthcare application. | Regulated industries (finance, healthcare) | SonarQube, Aqua Security, Snyk |
Continuous Integration (CI)
Continuous Integration (CI) is a DevOps way where developers often merge their code changes into a shared repo. They usually do this many times a day. Each integration sets off automated builds and tests. This helps catch errors early and boosts fast feedback and code quality.
Example − A dev team uses Jenkins to automate CI tasks. Builds and tests start with every code commit, making sure only error-free code gets into the main branch.
Continuous Deployment (CD) and Continuous Delivery
Continuous Deployment (CD) automates code releases to production as soon as they pass testing. Continuous Delivery sends code to a staging area and needs manual approval to go live. Both save manual work and speed up the release process.
Example − A company with a microservices setup uses Kubernetes for automated deployments, allowing frequent small updates with little disruption.
Infrastructure as Code (IaC)
Infrastructure as Code (IaC) lets teams manage and set up infrastructure using code instead of manual steps. This brings more automation, consistency, and easy scaling.
Example − Teams use Terraform scripts to set up cloud infrastructure. This lets them make identical environments for development, staging, and production.
Automated Testing and Quality Assurance
Automated Testing is important in DevOps. It helps teams check code through tests that run automatically in CI/CD pipelines. These tools and frameworks ensure that code changes don't break things or add new bugs.
Example − A QA team uses Selenium for automated UI tests on a web app. Tests run with every deployment, making sure all updates keep the app working.
Microservices and Containerization
With Microservices, we break applications into smaller, separate services. Each of these can be built, deployed, and scaled on its own. Containerization helps microservices by packing each service along with its needed files into small containers, making sure they work in different environments the same way.
Example − A company moves from a big, single architecture (monolithic) to a microservices setup using Docker and Kubernetes. This lets teams update specific services without affecting the whole app.
Monitoring and Observability
Monitoring helps us understand the health and performance of apps and infrastructure. Observability goes deeper. It lets us see how systems behave, making it easier to fix problems and boost performance. Together, they're key for keeping systems running smoothly and giving users a better experience.
Example − An e-commerce site uses Prometheus for monitoring and Grafana for charts. The DevOps team can set alerts for any latency or resource overuse.
Security Integration (DevSecOps)
In DevSecOps, we add security at every step of the DevOps process. Security isn't something we check only at the end. We set up automated security checks and vulnerability scanning in the CI/CD pipeline.
Example − A financial company adds static code analysis tools like SonarQube in its CI/CD pipelines. This catches security flaws during the development and testing phases.
Use Case 1: Implementing CI/CD for Large-Scale Applications
In large applications, where many developers change code quickly, CI/CD pipelines help us by automating code building, testing, and deployment. This helps us make fewer mistakes and speeds up how fast we can release updates.
Example − A social media platform with millions of users uses Jenkins for CI and Spinnaker for CD. They automate testing and slowly roll out new features. This way, they quickly bring updates to production while keeping everything stable and low risk.
Use Case 2: Scaling Infrastructure with IaC and Containers
As our applications grow, it gets hard to scale infrastructure by hand. Infrastructure as Code (IaC) and containerization help us by automating the scaling process. This allows us to define our environments in code and deploy them quickly.
Example − A fintech startup uses AWS and Terraform for IaC. This lets them automatically scale resources when demand is high. With Docker containers managed by Kubernetes, they can increase or decrease services based on the load. This helps us save costs and perform better.
Use Case 3: Ensuring Security and Compliance in CI/CD Pipelines
In industries with strict rules, we need to make sure security and compliance are part of every deployment. DevSecOps adds security checks into CI/CD pipelines. This helps us find problems early and ensures our applications follow industry rules before going live.
Example − A healthcare provider uses DevSecOps by adding tools like SonarQube and Aqua Security in their pipelines. These tools check codes for security issues to meet HIPAA rules. This ensures every code change is safe before we deploy it.
These real-world examples of DevOps show us how CI/CD, IaC, and DevSecOps help us be more scalable, efficient, and secure in complex and busy environments.
Conclusion
In this article, we looked at the main use cases of DevOps. We focused on Continuous Integration (CI), Continuous Deployment (CD), Infrastructure as Code (IaC), automated testing, microservices, monitoring and observability, and security through DevSecOps.
Each use case shows how DevOps helps us make our development processes smoother. It also improves teamwork, software quality, and security.
DevOps - Stakeholders
Stakeholders are people or groups who care about the success of a project. Their involvement is very important for promoting teamwork and aligning our goals. This ensures that we meet our development and operational targets effectively.
In this chapter, we will look at the main stakeholders in the DevOps environment. We will explore their roles, responsibilities, and why working together matters. We will identify stakeholders like development teams, operations, quality assurance, security teams, and business management. We will see how their interactions help make DevOps initiatives successful.
Identifying Key Stakeholders in DevOps
The following table highlights the key stakeholders in DevOps and their role in the software development cycle −
| Stakeholder | Role | Key Responsibilities | Examples |
|---|---|---|---|
| Development Teams | They write, test, and deploy code to create software applications. |
|
|
| Operations Teams | They manage the infrastructure and deployment to keep applications running well and efficiently. |
|
|
| Quality Assurance (QA) Teams | They check the software quality by testing it thoroughly. They look for defects and try to fix them. |
|
|
| Security Teams | They protect applications and data from security threats. They put security practices into the development process (DevSecOps). |
|
|
| Business and Product Management | They set the direction and goals for development projects. They make sure projects meet market needs and business goals. |
|
|
Collaboration among DevOps Stakeholders
In this section, let's discuss how the different stakeholders in DevOps collaborate among themselves during the software development cycle.
Communication Channels
Good communication is very important for teamwork in DevOps. Setting up clear communication channels helps information flow easily between teams. This way, they can make quick decisions and solve problems faster.
- Regular Meetings − Daily stand-ups, sprint planning, and retro meetings keep all teams on the same page. For example, a mixed team has a weekly meeting to talk about project progress and issues. This helps them make changes quickly.
- Instant Messaging Platforms − Tools like Slack or Microsoft Teams let team members talk in real time and share quick updates.
- Documentation − Using centralized document platforms like Confluence makes sure all stakeholders have the latest project information and decisions.
Tools and Technologies Supporting Collaboration
Many tools and technologies help improve teamwork among stakeholders in DevOps. These tools help automate work, integrate systems, and track tasks.
- Version Control Systems − Git helps developers work together on code, track changes, and manage code reviews. For example, using GitHub, teams can make pull requests for code reviews. This lets them discuss and ensure code quality before merging.
- CI/CD Tools − Continuous Integration and Continuous Deployment tools like Jenkins, CircleCI, and GitLab CI help automate testing and deployment. This promotes teamwork between development and operations. For example, a CI/CD pipeline runs tests automatically whenever new code is pushed. This keeps all stakeholders updated on the build status right away.
- Project Management Tools − Platforms like Jira or Trello show project progress and help manage tasks across teams. For example, a product manager uses Jira to create user stories and assign tasks. This helps developers and QA teams see progress and updates.
Continuous Feedback Loops
Continuous feedback loops are important in DevOps. They help stakeholders learn from each cycle and improve their work. These loops make sure feedback is not only collected but also acted on.
- Automated Testing − Adding automated tests in the CI/CD pipeline lets teams get quick feedback on code quality. For example, when a developer pushes code, automated tests run. The results go to the whole team, so they can quickly find issues.
- User Feedback − Talking to end-users to get their thoughts on new features helps teams change their development focus based on real needs. For example, after releasing a feature, the product team runs user surveys and checks usage data. This helps find areas that need improvement.
- Retrospectives − Regular retrospective meetings help teams think about their processes, successes, and problems. This encourages a culture of improvement. For example, at the end of each sprint, teams talk about what went well and what can be better. They make actionable changes for the next cycle.
By using good communication channels, collaborative tools, and continuous feedback loops, DevOps stakeholders can work together better. This makes the software delivery process much more effective
Stakeholder Challenges in DevOps
In this section, we have highlighted the types of challenges that the different DevOps stakeholders have to face −
Cultural Resistance
Cultural resistance is a big challenge when using DevOps practices. Old barriers between development, operations, and other teams can make it hard to change.
- Mindset Shift − Teams might stick to their old processes. They may not want to try new ways of working together. For example, developers might not want to include operations in early talks. They worry it could slow down their quick development cycles.
- Fear of Job Loss − Workers might think that DevOps automation could take away their jobs. This can cause them to resist new technology. For example, an operations team might push back on using automated deployment tools. They worry they will lose control over the deployment.
Misalignment of Goals
When teams do not align their goals, it can hurt the success of DevOps projects. If teams focus only on their goals and not the company's overall goals, it can cause problems and conflicts.
- Lack of Shared Vision − Different teams may focus on different goals. This can cause delays and confusion. For example, the development team may want to deliver features quickly. At the same time, the operations team may want to keep the system stable. This leads to tension.
- Communication Gaps − Not enough communication about project goals can make misalignment worse. For example, a product manager might set a deadline for a feature release without talking enough with development and QA. This can lead to rushed work and bugs.
Resource Constraints
Limited resources can really affect how well stakeholders work together and use DevOps practices. This can come from budget limits, not enough staff, or missing tools.
- Budget Limits − Organizations may find it hard to spend money on needed tools, training, or hiring to support DevOps projects. For example, a company may have to wait to use a new CI/CD tool because of budget limits. This can keep them stuck with manual processes longer.
- Skill Gaps − Not having enough training or skill in DevOps can stop teams from using new tools and methods. For example, if the development team doesn't know about container tools like Docker, it may slow down using a microservices architecture.
By fixing these challenges, organizations can make a better environment for successful DevOps use and teamwork among stakeholders.
Conclusion
In this chapter, we looked at the important role of stakeholders in a DevOps setting. We identified key teams like development, operations, QA, security, and business management. We showed how they work together using good communication, helpful tools, and constant feedback.
We also highlighted the problems that stakeholders face. These include cultural resistance, different goals, and a lack of resources. By knowing these issues, organizations can build a better culture for working together and being creative.
DevOps - Certifications
In today's fast-changing tech world, we see a big demand for professionals who know DevOps well. But with many tools, methods, and best practices, we can easily feel lost. This is why certifications are useful for anyone who wants to show their skills in this area.
In this chapter, we will explore DevOps certifications. We will look at why they matter and the different options available for us at various career stages. We will discuss the types of certifications we can get, point out some of the most recognized ones, and explain what we need to know to prepare for each.
Types of DevOps Certifications
We can split DevOps certifications into two main types: industry-recognized certifications and role-specific certifications. Each type serves a purpose and is designed for different people in the DevOps world.
Industry-Recognized Certifications
These certifications show that we understand DevOps principles, practices, and tools that are known worldwide. They focus on best practices that work across different platforms and technologies. This gives us a strong base if we want to prove our skills in DevOps.
Industry-recognized certifications are usually not tied to any one company. This lets us showcase our skills in widely used DevOps methods. They often cover topics like continuous integration, continuous delivery, infrastructure as code, and cloud-native practices.
Role-Specific Certifications
These certifications are made for specific jobs in the DevOps area. They provide us with special training based on our job roles.
Role-specific certifications meet the needs and tasks of different professionals. They help us gain the right skills and knowledge to succeed in our jobs. These certifications might focus on certain tools, practices, or methods that are important for developers, operations workers, or security experts.
Whether we want to gain general knowledge or focus on a specific role, we can find certifications that help us grow our careers in DevOps.
Top DevOps Certifications
Here's a detailed overview of some of the top DevOps certifications.
AWS Certified DevOps Engineer
- Target Audience − Professionals with experience in AWS and DevOps.
- Level − Professional
- Difficulty − Intermediate to Advanced
- Topics Covered − Continuous delivery and automation, Monitoring and logging, Security and Compliance, Incident and event response
- Suitable Roles − DevOps Engineer, Cloud Engineer, Automation Engineer
- Link − Learn more about AWS Certified DevOps Engineer
Microsoft Certified: DevOps Engineer Expert
- Target Audience − IT professionals familiar with Azure DevOps practices and tools.
- Level − Expert
- Difficulty − Intermediate to Advanced
- Topics Covered − Continuous integration and delivery, Infrastructure as code, Configuration management, Application Insights
- Suitable Roles − DevOps Engineer, Azure Developer, IT Operations Engineer
- Link − Learn more about Microsoft Certified: DevOps Engineer Expert
Certified Kubernetes Administrator (CKA)
- Target Audience − IT professionals with experience in Kubernetes.
- Level − Professional
- Difficulty − Intermediate to Advanced
- Topics Covered − Kubernetes architecture and installation, Networking, storage, and logging, Application lifecycle management, Troubleshooting and maintenance
- Suitable Roles − Kubernetes Administrator, Cloud Engineer, DevOps Engineer
- Link − Learn more about Certified Kubernetes Administrator (CKA)
HashiCorp Certified: Terraform Associate
- Target Audience − Professionals using Terraform for infrastructure management.
- Level − Associate
- Difficulty − Intermediate
- Topics Covered − Infrastructure as code principles, Terraform core concepts, Managing Terraform state, Provisioning and deploying resources
- Suitable Roles − DevOps Engineer, Cloud Engineer, Infrastructure Engineer
- Link − Learn more about HashiCorp Certified: Terraform Associate
Google Professional DevOps Engineer
- Target Audience − IT professionals experienced with Google Cloud Platform (GCP).
- Level − Professional
- Difficulty − Intermediate to Advanced
- Topics Covered − Site Reliability Engineering (SRE), Service monitoring and logging, Continuous delivery and infrastructure automation, Incident response and management
- Suitable Roles − DevOps Engineer, Cloud Architect, Site Reliability Engineer
- Link − Learn more about Google Professional DevOps Engineer
When we go for DevOps certifications, we need to know the requirements and the experience needed to help us succeed. Each certification has its own needs. Being well-prepared can improve our chances of passing the exams.
Prerequisites for DevOps Certifications
While the requirements can change for each certification, we can look at some common basics −
- Basic Understanding of DevOps Concepts − We should know important DevOps ideas. These include continuous integration, continuous delivery, and working together between development and operations teams.
- Familiarity with Tools and Technologies − It helps to know about popular DevOps tools like Git, Jenkins, Docker, and Kubernetes. Many certifications expect us to have some basic skills with these tools.
- Programming Knowledge − Knowing at least one programming or scripting language like Python, Java, or Bash can help in many DevOps jobs and certifications.
Recommended Experience and Knowledge
Besides the prerequisites, we should also think about certain levels of experience and knowledge that can help us −
- Professional Experience − Most certifications suggest having hands-on experience in a DevOps setting. This usually means 1 to 3 years of work. This experience helps us use what we learn in real situations, which is important for passing the exams.
- Understanding of Cloud Platforms − For certifications related to the cloud, we should know about platforms like AWS, Azure, or Google Cloud. Understanding cloud services and how they work can help us understand the certification material.
- CI/CD Practices − Experience with continuous integration and continuous deployment is often important since these are key parts of DevOps methods.
- Infrastructure as Code (IaC) − For certifications that focus on tools like Terraform or Ansible, we should understand IaC ideas and practices.
- Soft Skills − Skills like working together, communicating, and solving problems are important in DevOps jobs. Even if these skills are not always listed in certification requirements, they can really help us succeed.
By meeting these requirements and getting the right experience, we can be more ready for DevOps certifications. This will help us do well in our DevOps careers.
Preparation of DevOps Certifications
Preparing for DevOps certifications needs a good plan and the right tools. Here are some helpful strategies to make your study better −
| Study Materials and Resources |
|
| Online Courses and Bootcamps |
|
| Hands-on Labs and Practice Exams |
|
By using these preparation strategies, we can build a strong base and feel more confident before we take our certification exams.
Benefits of DevOps Certifications
Getting DevOps certifications has many benefits that can help your career. These certifications show your skills and improve your professional image in the industry. Here are some important benefits −
- Career Advancement − You can find new job opportunities and get promotions.
- Increased Earning Potential − You can earn more money than those without certifications.
- Industry Recognition − It proves your skills and your commitment to this field.
- Enhanced Knowledge − You learn more about DevOps methods and tools.
- Networking Opportunities − You can meet other professionals and industry leaders.
- Confidence Boost − You feel more sure of yourself in using DevOps ideas.
- Staying Up-to-date − You stay updated with new trends and technologies in DevOps.
By getting DevOps certifications, we make ourselves more knowledgeable and competitive in a fast-changing job market.
Conclusion
In this chapter, we looked at the main points of DevOps certifications. We talked about their types, requirements, best certifications, how to prepare, and why it is important to keep learning. When we understand DevOps certifications and the benefits they bring, like better job chances, higher pay, and recognition in the industry, we can make smart choices for our careers.
By getting these certifications, you gain important skills. It can also make you a sought after resource in the competitive tech field. Certifications can help you have a successful and rewarding career in DevOps.
DevOps - Essential Skills
In this chapter, we will look at the skills we need for good DevOps practices. We will discuss some technical skills such as version control systems, continuous integration, continuous deployment (CI/CD), and infrastructure as code (IaC). We will also see why containerization, orchestration, monitoring, and cloud computing are important in DevOps.
By the end of this chapter, you will have a good understanding of the key skills required to become a DevOps engineer. You will also learn how these skills help us work better and improve teamwork.
Key Skills Needed for DevOps
DevOps needs many skills. These include technical skills and soft skills. Below, we will look at the key skills for a successful DevOps career. We will give clear explanations and examples to show how important these skills are and how we can use them.
Version Control Systems
Version control systems (VCS) help us manage code changes. They let many developers work together and keep a history of changes in the project.
Key Tool − Git is the most popular version control system. It helps us track changes, go back to earlier versions, and work together on code easily.
Example − A team of developers working on a web app can use Git. Each developer makes a branch to work on a specific feature. When the feature is ready and tested, the branch merges back into the main branch with a pull request. This way, we can check the code and make sure it is good before deployment.
Continuous Integration and Continuous Deployment (CI / CD)
CI/CD is a set of practices that automate the integration and deployment processes. Continuous integration means we test and merge code changes automatically. Continuous deployment helps us release code changes to production quickly and safely.
Key Tools − Jenkins, GitLab CI, CircleCI. These tools automate the building, testing, and deployment processes. This lets us focus more on development.
Example − With Jenkins, a team sets up a CI/CD pipeline. It runs builds and tests whenever we push code to the repository. If tests pass, Jenkins automatically deploys the app to a staging area for further testing. If everything is okay, the code goes to production with little manual work.
Infrastructure as Code (IaC)
IaC lets us manage and set up infrastructure with code instead of doing it by hand. This method helps keep things consistent, reduces human errors, and speeds up setup.
Key Tools − Terraform, Ansible, Puppet. These tools help us automate the setup, configuration, and management of infrastructure.
Example − With Terraform, a DevOps engineer can write the code for the infrastructure for a web app. This includes servers, databases, and networking. If changes are needed, the engineer just updates the code, and Terraform changes the infrastructure to match.
Containerization and Orchestration
Containerization helps us package applications and their dependencies into containers. This ensures they work the same way in different environments. Orchestration tools manage how we deploy, scale, and run these containers.
Key Tools − Docker (for containerization), Kubernetes (for orchestration). These tools help us deploy and manage applications easily.
Example − A development team uses Docker to package their microservices application. Each service runs in its container. Kubernetes manages these containers. It scales based on traffic, does rolling updates, and helps with service discovery. This makes deployment easier.
Monitoring and Logging
Monitoring and logging are important to keep applications healthy and working well. They give us insights into how applications behave, help us find problems, and let us respond quickly.
Key Tools − Prometheus, Grafana, ELK Stack (Elasticsearch, Logstash, Kibana). These tools help us see metrics and logs. This makes it easier to keep an eye on our applications.
Example − Using Prometheus, a team sets up monitoring for their web app. It collects metrics like response times and error rates. Grafana helps us create dashboards to show these metrics in real-time. If there is a spike in error rates, the team can quickly check logs with the ELK Stack to find and fix the problem.
Cloud Computing
Cloud computing gives us resources and services over the internet. This makes it easy to scale and be flexible with our infrastructure. Understanding cloud services is important for deploying applications in DevOps.
Key Providers − AWS, Azure, Google Cloud. These platforms provide many services like computing, storage, and networking.
Example − A company using AWS can use services like EC2 for virtual servers, S3 for storage, and RDS for managed databases. By using these services, the team can change resources based on demand. This helps save costs and improve performance.
Collaboration and Communication
Good collaboration and communication are very important in DevOps. Teams work together across different functions. This means we need to share knowledge, solve problems, and align our goals.
Key Tools − Slack, Microsoft Teams, JIRA - These tools help us communicate and manage projects among team members.
Example − A DevOps team uses Slack for quick chats, making channels for different projects. They also use JIRA to track issues and tasks. This helps everyone stay on the same page about project progress and priorities.
Security in DevOps (DevSecOps)
Putting security into the DevOps process means security is everyone's job in the development and operations teams. This way, we can find vulnerabilities early in the software development process.
Key Tools − Snyk, Aqua Security, HashiCorp Vault - These tools help automate security checks and manage sensitive information.
Example − A development team uses Snyk to check their application for security issues. In the CI/CD pipeline, any issues are flagged for fixing before deployment. This makes sure we focus on security throughout development.
Soft Skills and Agile Methodologies
Besides technical skills, soft skills like communication, teamwork, and problem-solving are very important in DevOps. Knowing Agile methods helps teams adapt to changes and deliver value step by step.
Example − A DevOps team uses the Scrum method to manage their work. They have regular meetings to talk about progress and problems. This agile way helps with transparency and accountability. It lets the team adapt quickly to new challenges.
How to Add DevOps Experience to Resume?
It is important to show your DevOps experience on your resume. This helps show that you are skilled in this area. Here are some easy tips to highlight your DevOps skills and experience −
- Change your resume for each job you apply to. Focus on the DevOps skills and experiences that match the job description.
- Organize your resume into clear sections like "Technical Skills," "Professional Experience," and "Projects." This makes it easier to read.
- List important DevOps tools and technologies you know. Include things like Git, Jenkins, Docker, Kubernetes, Terraform, and cloud services.
- Use numbers to show your work. For example, say "Reduced deployment time by 30% using CI/CD."
- Add a "Projects" section. Here, you can talk about specific DevOps projects you worked on. Explain your role, the technologies you used, and the results.
- Talk about how you work with different teams. Mention any agile methods you have used, like Scrum or Kanban.
- Include any relevant certifications you have, like AWS Certified DevOps Engineer or Docker Certified Associate. This proves your skills.
- Use words from the job description. This helps you get through Applicant Tracking Systems (ATS).
- Mention any ongoing education, workshops, or training in DevOps. This shows that you want to keep learning in this field.
By using these tips, you can present your DevOps experience clearly. This will help your resume stand out to employers.
Conclusion
In this chapter, we looked at the key skills needed for a good career in DevOps. These skills include version control, CI/CD practices, infrastructure as code, containerization, monitoring, cloud computing, and working well with others and security.
We also talked about how to add DevOps experience to your resume. It is important to change your application for each job. Show your relevant skills and use numbers to highlight your achievements. By learning these skills and showing them well, you can become a strong candidate in the competitive world of DevOps.
DevOps - Job Opportunities
As businesses keep changing to digital, we see the need for skilled DevOps workers growing a lot. This change creates many job chances in different industries. In this chapter, we will look at DevOps job roles and trends that shape this field.
We will cover popular jobs like DevOps Engineer, Site Reliability Engineer, and Automation Engineer. We will also share details on salary expectations, networking tips, and how to build a portfolio. Whether you are professionals wanting to switch to DevOps or beginners wanting to start in this field, this chapter will give you the knowledge you need to explore the opportunities in DevOps.
Popular Job Roles in DevOps
The following table highlights some of the popular job roles in DevOps −
| Job Role | Role Overview | Responsibilities | Skills Required | Example |
|---|---|---|---|---|
| DevOps Engineer | Connects development and operations teams. Focuses on making processes easier and more reliable. |
|
Automates the deployment of microservices with Jenkins and Kubernetes at a tech startup. This cuts deployment time from hours to minutes. Uses Prometheus for real-time performance checks. | |
| Site Reliability Engineer (SRE) | Uses software and systems skills to build strong and reliable systems. Focuses on performance and uptime. |
|
Creates an auto-scaling tool for a large e-commerce site. Implements SLOs for 99.9% uptime during busy times and uses automated monitoring to solve problems early. | |
| Release Manager | Manages the planning and execution of software updates. Ensures updates and features are delivered smoothly. |
|
|
Leads the launch of a mobile banking app at a financial services company. Coordinates developers, testers, and security teams while making a release plan with timelines and risk checks. |
| Automation Engineer | Works on creating automated solutions to make repetitive tasks easier. This helps improve speed and lower mistakes. |
|
Builds automated tests with Selenium for a SaaS company to check feature functions before deployment. Makes CI/CD pipelines with Jenkins that automatically deploy the app after testing. | |
| DevSecOps Engineer | Puts security into the DevOps process. Makes sure everyone is responsible for security during development. |
|
|
Adds Snyk into the CI/CD pipeline at a healthcare tech company to scan for problems in third-party libraries. Teaches developers about safe coding practices to focus on security from the start. |
Industry Demand and Job Market Trends
The need for DevOps workers keeps growing. This shows how important it is for development and operations teams to work together. They help deliver software quickly and safely. This section talks about current job market facts and the rise of DevOps jobs in different industries.
Current Job Market Statistics
The DevOps job market is strong. Many companies need skilled workers. Here are some important facts about the job market now −
- Job Openings − Many job boards say there are more job postings for DevOps roles. LinkedIn has more than 40,000 active job listings for DevOps jobs in recent months.
- Salary Trends − The average pay for DevOps jobs is going up. Glassdoor says a DevOps Engineer earns about $115,000 per year. More experienced workers can earn over $150,000. Site Reliability Engineers also get similar pay because their skills are in high demand.
- Skills Gap − A survey from the DevOps Institute shows that 86% of companies see a skills gap in their DevOps teams. This means there is a big chance for people who want to join the field. Companies look for people with both technical and soft skills.
- Hiring Trends − The 2023 State of DevOps Report says 74% of companies plan to grow their DevOps teams in the next year. This growth comes from the need for faster software delivery and better teamwork.
Growth of DevOps Roles Across Industries
DevOps practices are not just in one industry. They are becoming important in many areas. Here is how DevOps roles are growing in key industries:
- The tech industry is the biggest employer of DevOps workers. Companies from startups to large firms invest in DevOps to improve software delivery. Big companies like Google, Amazon, and Microsoft have their own DevOps teams to stay competitive.
- Banks and financial companies are using DevOps to speed up their digital changes. They need fast software updates and to meet rules, so they need more DevOps workers. Companies like JPMorgan Chase and Goldman Sachs hire DevOps Engineers and SREs to improve their operations.
- The healthcare industry sees the benefits of DevOps too. It helps in making applications for patient care and data management. With strict rules and the need for quick changes, healthcare companies hire DevSecOps Engineers to add security to their development processes.
- The retail industry has more online shopping. This raises the need for DevOps to manage websites and customer experiences. Major retailers like Walmart and Target are using DevOps methods to improve their digital services and work better.
- With Industry 4.0 growing, manufacturing companies use DevOps to make their production better. They do this through automation and IoT (Internet of Things). The need for continuous software delivery for smart devices creates new jobs for DevOps workers in this area.
Salary Expectations in DevOps
The need for DevOps workers is growing. Because of this, the salary expectations for these jobs are also rising. Knowing the average pay for different job roles and what affects these salaries can help people who want to work in DevOps.
Average Salaries by Role
Salaries for DevOps jobs can change a lot. They depend on experience, location, and skills needed for each job. Here is a look at the average pay for important DevOps roles −
| Job Role | Average Salary (Annual) |
|---|---|
| DevOps Engineer | $115,000 - $150,000 |
| Site Reliability Engineer (SRE) | $120,000 - $160,000 |
| Release Manager | $100,000 - $140,000 |
| Automation Engineer | $110,000 - $145,000 |
| DevSecOps Engineer | $115,000 - $155,000 |
DevOps Engineer − Average salaries go from $115,000 to $150,000. More skilled workers can earn over $150,000, especially in areas where demand is high.
Site Reliability Engineer (SRE) − SREs usually make more. Their pay ranges from $120,000 to $160,000. This is because they are key to keeping systems running well.
Release Manager − Average pay is between $100,000 and $140,000. This depends on their experience and job duties.
Automation Engineer − Their salaries range from $110,000 to $145,000. This is due to the high demand for automation skills in many industries.
DevSecOps Engineer − Average salaries go from $115,000 to $155,000. This is because security is very important in the DevOps process.
Factors Influencing Salary (Experience, Location)
Many things can change the salary for DevOps workers. Here are some of them −
Experience Level
- Entry-level DevOps jobs usually start at $80,000 to $100,000. With more experience, salaries go up a lot.
- Mid-level workers with 3-5 years experience earn between $100,000 and $130,000.
- Senior workers with 5+ years of experience can make over $150,000. This is especially true for jobs like SRE or DevSecOps.
Geographic Location − Salaries can change a lot by location. Big tech cities like San Francisco, New York, Seattle, and Austin usually pay more. This is because of living costs and the need for skilled workers. For instance, a DevOps Engineer in San Francisco might earn about $160,000. In a smaller city, the same job may pay around $100,000.
Remote jobs are changing salary expectations too. Many companies now hire talent from anywhere and sometimes offer good salaries no matter where the worker lives.
Industry − The industry a DevOps worker is in can change their pay. Fields like finance and healthcare, which have strict rules and need strong security, often pay more than less regulated industries.
Skills and Certifications − Special skills, like knowing cloud platforms (AWS, Azure, GCP), container tools (Docker, Kubernetes), and automation tools (Jenkins, Ansible), can lead to higher pay.
Having certifications, like AWS Certified DevOps Engineer or Certified Kubernetes Administrator, can make a candidate more attractive and increase their pay potential
Conclusion
In this chapter, we looked at job opportunities in the DevOps field. We talked about popular jobs like DevOps Engineer, Site Reliability Engineer, and DevSecOps Engineer. We described their tasks and the skills needed. We check the current job market stats. We saw how DevOps roles are growing in many industries. This shows that the need for skilled workers is rising.
We also talked about salary expectations. We broke down average salaries by role. We looked at factors that influence pay, like experience, location, and industry. Knowing these things helps new professionals plan their careers. It also helps companies find and keep the best talent in the fast-changing world of DevOps.
DevOps - Agile
In this chapter, we will explore the main ideas of DevOps and Agile. We will look at their principles and practices. We will discuss how we can combine Agile methods with the DevOps pipeline. This will improve teamwork and automate tasks for a smooth workflow.
We will also check key Agile frameworks like Scrum and Kanban, and how they help DevOps practices. By the end of this chapter, we will understand how to use both DevOps and Agile to make our software development better.
Why Do We Need to Combine DevOps and Agile?
DevOps and Agile methods have become important tools that help teams deliver high-quality software quickly and adapt to changes. DevOps focuses on working together between development and operations. It builds a culture of continuous integration, delivery, and deployment. Agile, on the other hand, supports development in small steps. This helps teams react quickly to changes in needs and market conditions.
Combining DevOps and Agile methods is very important for organizations that want to improve their software development. This mix creates a culture of teamwork and shared responsibility among different teams. It helps break down the old barriers between development, operations, and other groups.
By bringing together DevOps ideas with Agile practices, we can speed up delivery cycles. This lets us respond quickly to customer feedback and market needs.
Also, the connection between DevOps and Agile helps us improve constantly through step-by-step processes and automation. Agile focuses on making small changes, so teams can release new features more often. DevOps makes sure these releases happen efficiently and reliably. This mix not only speeds up the whole development process but also improves the quality of software products. This leads to happier customers and gives us an edge in the market. In the end, blending DevOps and Agile helps organizations innovate fast while keeping high quality and reliability.
Key Principles of Agile and DevOps
The following table highlights the key principles of Agile and DevOps −
| Aspect | Agile Principles | DevOps Principles |
|---|---|---|
| Focus | Focus on customer teamwork and satisfaction | Focus on collaboration between development and operations |
| Development Process | Use step-by-step and small changes in development | Continuous integration and delivery |
| Feedback | Get ongoing feedback through each step | Maintain constant monitoring and feedback loops |
| Team Structure | Cross-functional teams that organize themselves | Cross-functional teams with shared responsibility |
| Planning | Create flexible plans that can change with needs | Use infrastructure as code for controlled environments |
| Quality Assurance | Ensure quality through regular testing and reviews | Implement automated tests and deployment pipelines |
| Documentation | Keep just enough documentation to support the team | Produce collaborative documents that evolve with the code |
| Adaptability | Adapt to change based on stakeholder feedback | Respond quickly to issues in production and customer needs |
| Value Delivery | Deliver working software frequently | Have frequent releases with continuous delivery |
| Culture | Encourage collaboration, trust, and communication | Foster a culture of shared ownership and responsibility |
Agile Frameworks and DevOps Integration
Bringing Agile frameworks together with DevOps helps teams work better. It makes workflows easier and improves how we develop software. Lets look at three popular Agile frameworks - Scrum, Kanban, and Lean - and see how we can connect them with DevOps.
Scrum
Scrum is an Agile framework. It focuses on delivering small pieces of work through short periods called sprints. These sprints usually last from 1 to 4 weeks. Scrum values teamwork, responsibility, and the ability to change plans.
Integration with DevOps
In Scrum, DevOps can work by getting development and operations teams to team up during the sprint. For example, in sprint planning, the development team can invite operations staff to talk about deployment needs and find any problems. This teamwork helps make deployments smoother and fix issues faster.
Example
A software team that makes a web application using Scrum can set up a DevOps pipeline. This pipeline can automate testing and deployment tasks. At the end of each sprint, the team can use Continuous Integration/Continuous Deployment (CI/CD) tools. These tools automatically test and deploy the latest version of the application to a staging area. This process allows for quick feedback and changes.
Kanban
Kanban is an Agile method. It shows work using a board called a Kanban board. This method focuses on limiting the work in progress to make work more efficient and smoother.
Integration with DevOps
Kanbans visual work system can be improved with DevOps by adding automated monitoring and deployment tools. This setup lets teams see their tasks, deployment status, and operational data.
Example
A team using Kanban can create a Kanban board to follow development tasks and deployment tasks. When developers finish features, they can trigger automatic deployments to a production area using CI/CD pipelines. Real-time monitoring tools can show performance data. This way, teams can quickly find and fix problems.
Lean Framework
Lean is an Agile framework that aims to give the most value while wasting the least. It focuses on improving processes, and efficiency, and delivering value to customers.
Integration with DevOps
Bringing Lean into DevOps helps organizations make processes easier and cut down waste in software delivery. This combination highlights how important it is to automate repetitive tasks and reduce delays.
Example
A company that follows Lean ideas can create a DevOps plan that automates testing and deployment tasks. This automation can save time on tasks that dont add value, like manual testing and deployments. For example, if a team takes several hours to deploy a new feature, automating this task can make deployment much quicker. This change helps the team respond faster to customer needs.
Measuring Success in DevOps and Agile
Measuring success in our DevOps and Agile efforts is very important. It helps us see how well we are doing and find ways to get better. We need to use Key Performance Indicators (KPIs) and metrics that match our organizational goals.
Key Performance Indicators (KPIs)
KPIs are clear numbers that show how teams perform in reaching specific goals. In DevOps and Agile, some common KPIs are −
- Lead Time − This is how long it takes for a feature to move from development to deployment. Shorter lead times show a more efficient process.
- Deployment Frequency − This measures how often we deploy to production. More deployments mean we can deliver features and fixes quickly.
- Change Failure Rate − This is the percentage of changes that cause failures or need to be rolled back. A lower change failure rate shows that we have better quality and stable releases.
- Mean Time to Recovery (MTTR) − This is the average time it takes to recover from a failure in production. Shorter recovery times show that we are resilient and can respond well.
By regularly checking these KPIs, we can see trends, find bottlenecks, and make smart decisions to improve our DevOps and Agile practices.
Metrics for Continuous Improvement
Continuous improvement is a key part of DevOps and Agile. Metrics are very helpful in this process. They give us insights into how well our team performs and how efficiently our workflows are. Some important metrics are −
- Cycle Time − This is the total time from when we start working on a task until it is finished. Reducing cycle time helps us deliver value faster.
- Work In Progress (WIP) − Tracking how much work is currently in progress helps us manage our capacity and avoid delays.
- Customer Satisfaction − Measuring customer feedback and satisfaction scores gives us insight into how well the software meets user needs.
- Quality Metrics − This includes the number of defects reported after release and how effective our testing is. Good quality metrics show that we have a strong testing process.
Case Studies and Real-World Examples
Many companies have done well with DevOps and Agile practices. These changes have led to big improvements in their software development.
One good example is Target, the retail giant. Target used Agile practices to improve teamwork among their groups. They focused on Scrum to work in short sprints. This way, they could respond quickly to market needs. At the same time, they added DevOps tools for continuous integration and deployment. This mix helped Target cut the time to launch new features from weeks to just a few days. This change made customers happier and helped boost sales.
Another example is Etsy, the online marketplace. Etsy had problems with how often they could deploy and the reliability of their system. By using DevOps principles, they automated their deployment pipeline. Now, they can do multiple deployments each day. They also added Agile practices to help teams work better together. Because of this, Etsy greatly improved its change failure rate. This change made their platform more stable and improved the user experience.
Conclusion
In this chapter, we looked at how DevOps and Agile work together. We talked about why they are important in todays software development. We covered key ideas and different Agile frameworks like Scrum, Kanban, and Lean. We saw how these frameworks can work well with DevOps practices.
DevOps - Lean Principles
When we bring Lean principles into DevOps, it helps make software delivery better. Lean focuses on removing waste, improving teamwork, and prioritizing customer value. This combination helps teams deliver faster. It also saves money and keeps quality high.
What are Lean Principles?
Lean is a way of working that reduces waste and improves how we deliver value. It started in manufacturing but now works well in software delivery too. It helps simplify processes and get better results.
Following are the main ideas of Lean −
- Remove Waste − Stop doing tasks that don't add value.
- Keep Improving − Always look for ways to get better.
- Focus on Value − Deliver what customers need.
- Team Empowerment − Work together and share responsibility.
Why Lean Principles Matter in DevOps?
Lean and DevOps go well together. Both focus on efficiency and quality. When we use Lean with DevOps, it helps us −
- Shorten Cycle Time − Speed up development and deployment.
- Work Together Better − Break down team barriers.
- Boost Quality − Ensure every step is done well.
- Meet Customer Needs − Deliver what users expect.
By using Lean with DevOps, teams can deliver faster, better use resources, and adapt quickly to customer needs.
Key Lean Principles in DevOps
Lean principles help DevOps teams work more efficiently. They focus on teamwork and constant improvement. These principles make it easier to deliver good software faster. Below are the main ideas we follow in DevOps.
| Lean Principles | Descriptions | Key Practices / Tools |
|---|---|---|
| Eliminating Waste | We focus on removing work that doesnt add value. This helps to improve processes and save resources. | Automation, reducing handoffs, and making workflows simpler. |
| Building Quality | We add quality checks at every step of the pipeline. This helps us catch problems early and fix them. | Automated testing, continuous integration, and real-time monitoring. |
| Creating Knowledge | Sharing knowledge and learning together makes decision-making better and boosts new ideas. | Writing documentation, postmortems, and using shared platforms like wikis. |
| Delivering Fast | We work on speeding up processes without lowering quality. This helps us respond to changes quickly. | Short feedback loops, continuous delivery, and quick rollbacks when something fails. |
| Respect for People | A good team culture is important. We value and empower our team members so they feel responsible. | Collaboration, making team members feel safe to speak, and sharing responsibilities. |
| Optimizing the Whole | Instead of focusing on small parts, we work to improve the whole system for better results. | Value stream mapping and monitoring overall system performance. |
How to Apply Lean Principles in DevOps?
We can improve the CI/CD pipeline by finding and removing slow points. We make workflows simpler and automate them to speed up code deployment. This helps us deploy faster and with less manual work.
Our goal is to reduce the time it takes to move from development to production. We can achieve this by having shorter development cycles. We also focus on better teamwork and automating testing and deployment to avoid delays and increase speed.
We automate tasks that are done over and over, like testing code, building, deploying, and setting up infrastructure. This helps us reduce mistakes, deliver faster, and keep things consistent in different environments.
By using these Lean practices, we can make our DevOps processes much more efficient. We can deliver software faster while keeping quality high.
Lean Tools and Techniques in DevOps
The following Lean tools and techniques give us practical ways to improve collaboration, speed, and quality in software development and delivery −
Value Stream Mapping is the technique that helps us see the whole workflow, from idea to delivery. We can find problems and waste by looking at each step. This helps us spot delays, slow points, and areas that need improvement. By doing this, we can focus on activities that add value and improve the flow and productivity.
Kanban is a tool that helps us track work and manage what’s being worked on. It limits the number of tasks being worked on at the same time (WIP) to prevent bottlenecks. This helps the workflow smoothly and speeds up delivery. By checking flow efficiency regularly, we can find and remove obstacles, so work moves faster through the pipeline.
Kaizen is about making small improvements over time. In DevOps, it means we regularly look at our processes, get feedback, and make changes to improve things. We build a culture of continuous improvement so we can innovate, fix problems early, and keep getting better at delivering faster and with higher quality.
Metrics to Measure Lean in DevOps
In this section, we have highlighted the key metrics to measure Lean in DevOps −
Lead Time
Lead time is the time it takes for a piece of work, like a feature or bug fix, to go from the start of development to being live in production. A shorter lead time means we can deliver faster and work more efficiently.
Example − If a developer commits code on Monday and the feature is live by Thursday, the lead time is 4 days.
Deployment Frequency
This metric shows how often we deploy software to production. High deployment frequency means we have a fast CI/CD pipeline and can quickly deliver features or fixes.
Example − If we deploy code to production three times a day, the deployment frequency is three deployments per day.
Change Failure Rate
Change failure rate measures the percentage of deployments that cause problems, like bugs or crashes. A lower failure rate shows better code quality and testing.
Example − If 10 deployments happen and 2 cause errors in production, the change failure rate is 20%.
Mean Time to Recovery (MTTR)
MTTR tells us how long it takes to restore a service after a failure. A short MTTR shows that we can fix issues quickly and get things back to normal.
Example − If a service goes down at 10 AM and is fixed by 12 PM, the MTTR is 2 hours.
By tracking these metrics, we can measure how well our Lean DevOps practices are working. It helps us find areas that need improvement and make our software delivery process better.
Conclusion
In this chapter, we explored the main ideas of Lean in DevOps. We examined its principles, tools, techniques, and important metrics to measure success. We talked about how Lean practices like improving CI/CD pipelines, reducing cycle time, and automating tasks can help us work faster, deliver more quickly, and get better results.
We also highlighted the challenges the teams have to face when using Lean in DevOps and shared solutions to solve them. Using Lean principles, we can improve teamwork, cut waste, and improve the software delivery process. This helps us create a more agile and effective DevOps environment.
DevOps - AWS Solutions
DevOps is a way of working that brings together software development (Dev) and IT operations (Ops). It focuses on teamwork, automation, and delivering updates quickly to make the software development lifecycle (SDLC) faster.
Key principles of DevOps
Key principles of DevOps include −
- Continuous Integration (CI) − Frequently merging code into a shared repository.
- Continuous Delivery (CD) − Automating deployments for quicker releases.
- Infrastructure as Code (IaC) − Using code to manage infrastructure for consistency and easier scaling.
- Monitoring and Feedback − Getting real-time insights into performance and issues.
Importance of AWS in DevOps Workflows
AWS gives us powerful tools to make DevOps work smoothly −
- Scalability and Flexibility − Services like EC2, Lambda, and ECS/EKS adjust infrastructure to handle changing workloads.
- End-to-End Toolchain − Tools like CodePipeline, CodeBuild, and CodeDeploy support every step of the CI/CD process.
- Automation − AWS CloudFormation and CDK help us automate and repeat infrastructure setups.
- Global Reach − AWS's global network allows reliable and low-latency deployments.
AWS makes it easier for us to follow DevOps best practices. It also speeds up how quickly we can deliver applications.
Key AWS Services for DevOps
AWS gives us many services designed for DevOps. These services help with automation, scaling, and making workflows easier.
| Service | Description | Key Features |
|---|---|---|
| AWS CodePipeline | Helps us automate CI/CD workflows. It builds, tests, and deploys applications. |
|
| AWS CodeBuild | A managed build service. It compiles code, runs tests, and creates artifacts. |
|
| AWS CodeDeploy | Automates deployment to EC2, Lambda, and on-premises servers. |
|
| AWS CodeCommit | A managed source control service for private Git repositories. |
|
| AWS CloudFormation | Automates setup and management of AWS resources using Infrastructure as Code (IaC). |
|
Continuous Integration and Delivery on AWS
When we use CI/CD workflows on AWS, it makes integrating code changes, running tests, and deploying across environments smooth and consistent. AWS services like CodePipeline, CodeBuild, and CodeDeploy work together to create a solid pipeline for these tasks.
Building CI / CD Pipelines with AWS CodePipeline
AWS CodePipeline helps us build complete CI/CD workflows. It automates steps from source control to deployment. Pipelines can start based on events like code commits or set schedules.
Example
Take a look at the following example −
Source Stage − We set the pipeline to track changes in a GitHub repo.
ActionProvider: GitHub

RepositoryName: my-app

BranchName: main
Build Stage − Use AWS CodeBuild to compile and test the app.
Deploy Stage − AWS CodeDeploy can push the final artifact to EC2 or Lambda.
CodePipeline runs each stage in real-time. It also gives us detailed logs to debug any issues.
Automating Builds with AWS CodeBuild
AWS CodeBuild compiles our code, runs tests, and creates build outputs. It works with many programming languages and environments. We can use predefined build images or custom Docker images.
Example buildspec.yml
version: 0.2

phases:

  install:

    commands:

      - echo Installing dependencies

      - npm install

  build:

    commands:

      - echo Building the app

      - npm run build

artifacts:

  files:

    - '**/*'
When linked with CodePipeline, CodeBuild handles the build stage automatically. Each commit triggers a tested and compiled artifact.
Deployment Strategies with AWS CodeDeploy
AWS CodeDeploy handles application deployment to EC2, Lambda, or even on-premises servers. It offers different strategies to ensure smooth updates with minimal downtime:
In-Place Deployment − Updates existing instances. Best for small apps where a little downtime is okay.
Blue / Green Deployment − Creates a new setup with updated code and moves traffic slowly. Avoids downtime by keeping the old version ready.
Example AppSpec.yml for EC2
version: 0.0

os: linux

files:

  - source: /src

    destination: /var/www/html

hooks:

  BeforeInstall:

    - location: scripts/install_dependencies.sh

      timeout: 300

  ApplicationStart:

    - location: scripts/start_server.sh
With CodeDeploy, we can monitor deployments using Amazon CloudWatch. If something fails, it can roll back automatically.
By using CodePipeline, CodeBuild, and CodeDeploy together, AWS gives us a scalable, secure, and efficient CI/CD process. It makes our workflow reliable and easy to manage.
Infrastructure as Code (IaC) with AWS
Infrastructure as Code (IaC) is an important practice in DevOps. It lets us manage infrastructure using code instead of doing things manually. AWS has useful tools like CloudFormation and the AWS Cloud Development Kit (CDK). These tools help us automate, keep things consistent, and scale our infrastructure.
Using AWS CloudFormation
AWS CloudFormation helps us create and manage AWS resources using templates in JSON or YAML. These templates describe everything in our infrastructure like EC2 instances, VPCs, Lambda functions, and more. This lets us deploy the same infrastructure every time, consistently.
CloudFormation is good because we just need to tell it what we want. It takes care of provisioning and managing dependencies.
Example: CloudFormation Template
Here's a simple CloudFormation YAML template that creates an S3 bucket −
AWSTemplateFormatVersion: '2010-09-09'

Resources:

  MyS3Bucket:

    Type: 'AWS::S3::Bucket'

    Properties:

      BucketName: my-awesome-bucket
With this template, CloudFormation automatically creates an S3 bucket with the name we provided. If we change the template, like adding an EC2 instance, CloudFormation will automatically update the infrastructure. This keeps everything consistent and reduces human mistakes.
CloudFormation also supports features like stack updates, change sets, and nested stacks. These features help us manage bigger and more complex infrastructures. We can also use CloudFormation with other AWS DevOps tools like CodePipeline to automate the creation of our infrastructure in the CI/CD pipeline.
Introduction to AWS CDK
AWS CDK is a framework that helps us define cloud infrastructure using programming languages like Python, TypeScript, Java, and C#. It makes IaC easier by letting developers work with higher-level concepts instead of low-level details.
With CDK, we use constructs (pre-built AWS services) that hide the complicated parts of CloudFormation. The CDK takes our code and turns it into a CloudFormation template. This template is then used to create the resources.
Example: CDK in Python
Here's how we can define an S3 bucket with AWS CDK in Python −
from aws_cdk import core

import aws_cdk.aws_s3 as s3

class S3BucketStack(core.Stack):

    def __init__(self, scope: core.Construct, id: str, **kwargs) -> None:

        super().__init__(scope, id, **kwargs)

        s3.Bucket(self, "MyS3Bucket", bucket_name="my-awesome-bucket")

app = core.App()

S3BucketStack(app, "S3BucketStack")

app.synth()
In this example, the S3BucketStack class defines an S3 bucket, and app.synth() creates the CloudFormation template. CDK simplifies our work by using object-oriented concepts, which reduces repetitive code and helps developers be more productive.
CDK also makes it easier to work with higher-level concepts like a VPC or ECS cluster. We don't have to deal with the detailed resources. For example, we can define an Amazon ECS cluster with an application load balancer in just a few lines of code. This makes CDK great for developers who prefer working with code instead of long YAML or JSON templates.
Monitoring and Logging in AWS for DevOps
The following AWS tools are used for monitoring and logging activities in a DevOps pipeline –
AWS CloudWatch for Monitoring
CloudWatch helps us monitor AWS resources and applications in real-time. It collects and tracks metrics, logs, and events. We can set alarms based on certain thresholds to scale automatically or get notifications.
Example
Set an alarm for EC2 CPU usage −
aws cloudwatch put-metric-alarm --alarm-name HighCPUUsage
--metric-name CPUUtilization --namespace AWS/EC2
--statistic Average --period 300 --threshold 80
--comparison-operator GreaterThanThreshold
--dimensions Name=InstanceId,Value=i-1234567890abcdef0
AWS CloudTrail for Auditing
CloudTrail tracks and records all API calls made in AWS. It gives us full visibility into actions across the account. It helps us monitor and log activities for security and compliance. We can connect CloudTrail with CloudWatch for automatic alerts on suspicious activities.
Example
Set up a trail to audit Lambda invocations.
Centralized Logging with Amazon OpenSearch
OpenSearch (previously called Elasticsearch) gives us a scalable solution for logging. We can collect logs from many sources (e.g., EC2, Lambda, CloudWatch) and store them in OpenSearch. Kibana, which works with OpenSearch, helps us analyze and visualize logs.
Example
Push logs from EC2 to OpenSearch for easy storage and analysis.
Security in DevOps Pipelines on AWS
The following AWS solutions are used in implementing security in DevOps pipelines −
Implementing IAM Roles and Permissions
We use IAM (Identity and Access Management) roles to control who can access AWS resources in DevOps pipelines. Always give permissions based on the principle of least privilege (only what's needed).
Example
Create an IAM role that allows deployment to EC2 but not deleting resources.
Secrets Management with AWS Secrets Manager
AWS Secrets Manager helps us store and manage sensitive information like database passwords and API keys. It works with other AWS services to inject secrets into applications automatically.
Example
Store database passwords in Secrets Manager and access them securely in a Lambda function using the AWS Secrets Manager SDK.
Securing CI / CD Pipelines
We use IAM roles and policies to control access to services like CodePipeline, CodeBuild, and others. Secrets (e.g., API keys) should be stored in AWS Secrets Manager, not in the code repo. Make sure all artifacts and logs in CodeBuild and CodePipeline are encrypted.
Example
Use aws kms encrypt to protect sensitive data in the pipeline.
Scaling and Resilience in DevOps Workflows
In this section, we have highlighted the AWS tools that help in scaling and resilience in DevOps workflows −
Auto-scaling with AWS Elastic Beanstalk
Elastic Beanstalk automatically adjusts the number of EC2 instances based on demand. It handles scaling according to the thresholds we set.
Example
Set auto-scaling for an Elastic Beanstalk environment to handle traffic spikes better.
Managing Containerized Applications with Amazon ECS / EKS
Amazon ECS (Elastic Container Service) and Amazon EKS (Elastic Kubernetes Service) make it easier to manage containers. ECS works with AWS Fargate to run serverless containers. EKS helps us manage Kubernetes clusters for more flexible applications.
Example
Use ECS to scale containers based on CPU usage with ECS Service Auto Scaling.
Ensuring Resilience with AWS Fault Injection Simulator
AWS Fault Injection Simulator lets us simulate failures and test how resilient our systems are. It helps us find weaknesses in our apps and improve fault tolerance.
Example
Simulate a network failure to see how the application reacts to outages and improve recovery plans.
Conclusion
In this chapter, we explained all the important AWS services and practices for DevOps workflows. We looked at monitoring with AWS CloudWatch, auditing with CloudTrail, and using OpenSearch for centralized logging. We also discussed how to secure CI/CD pipelines with IAM roles, AWS Secrets Manager, and best practices for resilience and scalability. We covered services like Elastic Beanstalk, ECS/EKS, and AWS Fault Injection Simulator.
By using these AWS tools, DevOps teams can automate better, improve security, ensure scalability, and make systems more resilient. This leads to faster and more reliable software delivery.
DevOps - Azure Solutions
DevOps on Azure is all about bringing development and IT operations together. It helps us deliver software faster, with better quality and more reliability. Azure gives us a strong platform to set up DevOps. It has tools for continuous integration (CI), continuous delivery (CD), infrastructure as code (IaC), and monitoring.
With Azure DevOps, we can manage code repositories, automate workflows, and deploy apps easily to services like Azure App Service or Kubernetes. It has different services like Azure Repos, Pipelines, Boards, Artifacts, and Test Plans. These services help at every step of the DevOps lifecycle. They make collaboration easy and create a smooth delivery process.
Why Choose Azure for DevOps?
Azure gives us a complete DevOps solution. It comes with enterprise-level tools, great scalability, and availability worldwide. It supports many programming languages, frameworks, and third-party tools. This makes it flexible for different types of projects.
Azure DevOps is known for its strong CI/CD pipelines. It works well with GitHub and makes deploying apps to Azure cloud simple. Security is a big focus. Tools like Azure Key Vault help us manage secrets, and Azure Policy takes care of governance.
Azure also uses AI to give us insights and monitoring tools like Application Insights. These help fix issues before they become big problems and improve performance. All of this makes Azure a great platform for modern DevOps practices.
Setting up Azure DevOps
Azure DevOps gives us tools to handle the whole software process, from planning to deployment. Setting it up is simple. We prepare the environment, create an organization, and use services like Azure Repos and Pipelines. Let's go step by step.
Prerequisites
Before you start, make sure you have these ready −
- Azure Account − You can create one on the Azure Portal.
- Subscription − An active Azure subscription is needed for advanced features.
- Git Installed − Check if Git is installed. Use git --version to confirm.
- Development Environment − Use tools like Visual Studio or VS Code. They work directly with Azure DevOps.
Creating an Azure DevOps Organization
An organization in Azure DevOps is like a main container for projects and users.
Sign In − Go to Azure DevOps and log in with your Microsoft account.
Create Organization
- Click New Organization.
- Enter a name, like MyDevOpsOrg, and choose a region.
- Click Continue.
- Add a Project:
- Inside your organization, click New Project.
- Add details like the Project Name, visibility (Private or Public), and version control (Git or TFVC).
Given below is an example YAML for setting up a pipeline −
trigger:
  - main
pool:
  vmImage: 'ubuntu-latest'
steps:
  - script: echo "Hello Azure DevOps!"
    displayName: 'Print Message'
Overview of Azure DevOps Services
Azure DevOps offers several services. We can pick and use only the ones we need −
Azure Repos − Helps us manage code repositories. Example to push code −
git init
git remote add origin https://dev.azure.com/MyDevOpsOrg/MyProject/_git/MyRepo
git add .
git commit -m "Initial commit"
git push -u origin main
Azure Pipelines − Automates CI/CD workflows. For example, deploying a Node.js
app:
pool:
  vmImage: 'ubuntu-latest'
steps:
  - task: NodeTool@0
    inputs:
      versionSpec: '14.x'
  - script: npm install
    displayName: 'Install Dependencies'
  - script: npm test
    displayName: 'Run Tests'
Azure Boards − Tracks tasks, sprints, and overall progress.
Azure Test Plans − Lets us manage and automate tests.
Azure Artifacts − Handles and shares packages like npm, Maven, or NuGet.
This setup makes it easy to fit Azure DevOps into existing workflows. It's efficient and scales well for different needs.
Azure Pipelines: CI / CD
Azure Pipelines helps us automate building, testing, and deploying apps. It has two options - YAML pipelines for more flexibility and Classic pipelines with a simple graphical interface. Heres how we can create and use these pipelines for Continuous Integration (CI) and Continuous Deployment (CD).
Creating Build Pipelines
Build pipelines help us compile source code, run tests, and create build artifacts.
Steps to Create
- Open Pipelines in your Azure DevOps project.
- Click New Pipeline.
- Choose the repository you want (like GitHub or Azure Repos).
- Pick a YAML file or set up with a template.
Example YAML Build Pipeline for a .NET Project −
trigger:
  - main
pool:
  vmImage: 'windows-latest'
steps:
  - task: UseDotNet@2
    inputs:
      packageType: 'sdk'
      version: '6.x'
  - script: dotnet build
    displayName: 'Build the project'
  - script: dotnet test
    displayName: 'Run Unit Tests'
Save this file as azure-pipelines.yml in the main folder of your repo.
Every time we push to the main branch, this pipeline will run.
Setting Up Release Pipelines
Release pipelines let us deploy build artifacts to environments like staging or production.
Steps to Create −
- Go to Pipelines > Releases.
- Click New Pipeline and choose a template (like Azure App Service deployment).
- Link it to the build artifacts from the Build Pipeline.
- Add stages for deployment (e.g., Development, Testing, Production).
Example Configuration for Web App Deployment −
- Artifact Source − Link to the output from the build pipeline.
- Tasks − Add Azure App Service Deploy task. Fill in App Service Name, Package or Folder, and Azure Subscription.
YAML Pipelines vs Classic Pipelines
The following table highlights how YAML Pipelines differ from Classic Pipelines −
| Feature | YAML Pipelines | Classic Pipelines |
|---|---|---|
| Definition | Stored in a YAML file in the repo. | Configured through Azure DevOps UI. |
| Flexibility | Very customizable and version-controlled. | Simple setup for smaller projects. |
| Triggering | Works with branches, pull requests, etc. | Fewer triggering options. |
| Example YAML | Below example shows deployment to Azure App Service: | Not applicable |
trigger:
  - main
pool:
  vmImage: 'ubuntu-latest'
steps:
  - task: AzureWebApp@1
    inputs:
      azureSubscription: '<Your Azure Subscription>'
      appName: '<Your App Service Name>'
      package: '$(Pipeline.Workspace)/drop/*.zip'
YAML pipelines work best for big projects and teams. They allow automation and collaboration. Classic pipelines are simpler and good for quick setups or if YAML seems too complex.
Infrastructure as Code (IaC) with Azure
Infrastructure as Code (IaC) helps us manage cloud resources with code. It makes provisioning automatic and simpler. Azure supports many IaC tools. These tools bring consistency, version control, and easy repeatability. We can use Azure Resource Manager (ARM) templates, Terraform, or similar tools to define and deploy infrastructure easily.
Introduction to IaC on Azure
Azure supports IaC with −
- ARM Templates − These are JSON-based templates made just for Azure.
- Terraform − A third-party tool that works across different clouds, including Azure.
Using IaC reduces mistakes because it removes most manual steps. It keeps environments consistent and makes rolling back changes easier. When we use IaC with CI/CD pipelines, it ensures smooth and automated setups for infrastructure.
Using Azure Resource Manager (ARM) Templates
ARM templates define Azure resources in JSON. They work declaratively, so we write what we need, and Azure sets it up.
Structure
- Resources − List the Azure services to deploy.
- Parameters − These make the templates reusable. We can provide inputs like names or regions.
- Outputs − They return key information after deployment.
Example ARM Template for a Virtual Machine
{
  "$schema": "https://schema.management.azure.com/schemas/2019-04-01/deploymentTemplate.json#",
  "contentVersion": "1.0.0.0",
  "parameters": {
    "vmName": { "type": "string" },
    "adminUsername": { "type": "string" },
    "adminPassword": { "type": "securestring" }
  },
  "resources": [
    {
      "type": "Microsoft.Compute/virtualMachines",
      "apiVersion": "2021-07-01",
      "name": "[parameters('vmName')]",
      "location": "eastus",
      "properties": {
        "hardwareProfile": { "vmSize": "Standard_DS1_v2" },
        "osProfile": {
          "computerName": "[parameters('vmName')]",
          "adminUsername": "[parameters('adminUsername')]",
          "adminPassword": "[parameters('adminPassword')]"
        }
      }
    }
  ]
}
Deployment − Deploy with Azure CLI.
Managing IaC with Terraform and Azure
Terraform is another tool we can use to manage Azure resources. It's flexible, supports multiple clouds, and tracks the state of resources.
Install Terraform − Download Terraform from Terraform Downloads.
Create Terraform Configuration
provider "azurerm" {
   features {}
}
resource "azurerm_resource_group" "example" {
   name     = "example-resources"
   location = "eastus"
}
resource "azurerm_storage_account" "example" {
   name                     = "examplestorageacct"
   resource_group_name      = azurerm_resource_group.example.name
   location                 = azurerm_resource_group.example.location
   account_tier             = "Standard"
   account_replication_type = "LRS"
}
Use the following commands to manage resources −
Initialize
terraform init
Plan
terraform plan
Apply
terraform apply
Terraform lets us reuse configurations, manage the state, and use many community modules. These make managing Azure resources easier and faster.
Monitoring and Logging with Azure
Azure gives us strong tools to track how resources perform, how applications run, and to spot any problems. Below is a simple overview in a table format.
| Feature | Description | Example |
|---|---|---|
| Integrating Azure Monitor | Helps monitor Azure resources and apps from one place. | Set up alert for high CPU usage: az monitor metrics alert create --name HighCPUAlert. |
| Application Insights for Observability | Tracks how apps perform and how users interact with them. | Add this code to track events: appInsights.trackEvent({ name: "UserLogin" });. |
| Log Analytics for DevOps | Lets us query and analyze log data using KQL (Kusto Query Language). | Example query: `AzureDiagnostics` |
Security in Azure DevOps
Azure DevOps offers built-in security features to protect our resources, manage secret data, and keep pipelines safe. Below is a quick summary.
| Feature | Description | Example |
|---|---|---|
| Managing Permissions and Access Control | Uses RBAC (Role-based access control) to protect resources. | Add permission: az devops security permission add --id <role-id> --user-id <user-id>. |
| Secrets Management with Azure Key Vault | Stores secrets, keys, and certificates safely. | Pipeline task example: Use AzureKeyVault@2 to get secrets for deployment. |
| Integrating Security Testing in Pipelines | Adds automatic security checks in CI/CD pipelines for both static and dynamic testing. | Add tasks like WhiteSource Bolt or SonarQube in YAML to find vulnerabilities during builds. |
YAML Example for Secure Deployment with Key Vault Integration −
trigger:
  - main
pool:
  vmImage: 'ubuntu-latest'
steps:
  - task: AzureKeyVault@2
    inputs:
      azureSubscription: 'MyAzureSubscription'
      KeyVaultName: 'MyKeyVault'
      SecretsFilter: '*'
  - script: echo $(mySecret)
    displayName: 'Display Secret for Debugging'
Conclusion
In this chapter, we focused on setting up Azure DevOps, creating CI/CD pipelines, using Infrastructure as Code (IaC) with ARM templates and Terraform, and making sure our monitoring, logging, and security practices are strong.
By using Azure Monitor, Application Insights, and Log Analytics, we made resource management and observability better. We also talked about how to secure Azure DevOps by controlling access, managing secrets with Azure Key Vault, and adding security tests to pipelines. These practices help automate, secure, and monitor the software delivery process, making DevOps workflows on Azure more efficient, reliable, and safe.
DevOps - Continuous Development
Continuous Development (CD) means automating and improving the stages of software development, from writing code to deploying it. This helps release updates quickly and smoothly.
Goals of Continuous Development
The key goals of Continuous Development are:
- Frequent Code Updates − Quickly deliver new features, improvements, and bug fixes.
- Automation − Automate integration, testing, and building to reduce human mistakes and speed up development.
- Collaboration − Improve developer, QA teams, and operations teamwork for smooth deployment.
- Quality − Keep high code quality and stability even with frequent updates.
The main aim is to speed up time-to-market, lower risks, and help teams respond faster to user needs and business goals.
How Does Continuous Development Fit into the DevOps Lifecycle?
Continuous Development is an important part of the DevOps lifecycle. It focuses on automating and improving development before code is released to production. Heres how it fits −
- Continuous Development starts after Continuous Integration (CI). In CI, code changes are merged into a shared repository. CI makes sure the code is tested and built automatically.
- CD goes further by automating the build and integration process. After the code is integrated, it goes through automated build and staging stages, getting ready for deployment.
- After the development stage, CD ensures that code can smoothly move to deployment or staging, even if it's ready for production.
In short, Continuous Development helps DevOps teams keep a steady flow. It lets them handle many code changes and releases quickly while keeping the process smooth and automated.
Now, let's proceed and understand some key concepts in Continuous Development.
Code Integration and Collaboration
In Continuous Development, code integration and collaboration are key to making the development process faster and smoother. It helps team members work together effectively. Here are the main points −
- Developers push code often. This helps update the shared repository without delay.
- Tools like GitHub, GitLab, or Bitbucket help teams work together. They allow code reviews and merging to be done easily.
- The CI pipeline gives automated feedback. This helps developers find problems early and makes teamwork better, reducing integration issues.
The main goal is to keep a steady flow of updates, reduce conflicts, and make sure all changes fit smoothly into the common codebase.
The Role of Version Control in Continuous Development
Version control is very important in Continuous Development. It helps teams manage and track code changes simply. Here's why it matters:
- Version control systems (VCS) like Git track every code change. Developers can see the history of changes and go back to earlier versions if needed.
- VCS lets many developers work on the same project without overwriting each other's work. With branching and merging, teams can work on different features or fixes at the same time.
- Version control helps manage different code versions. It makes releasing new versions and applying patches easy without affecting the main production code.
By using branching strategies (like feature branches and hotfixes), teams make sure their work is separate. They can merge it when ready, keeping the main code stable while allowing constant development.
Building the Continuous Development Pipeline
A Continuous Development pipeline automates the process of moving code from commit to deployment-ready. The basic workflow has several stages −
- Code Commit − Developers commit their changes to a shared version control system like Git.
- Build − The code is automatically built using CI tools like Jenkins or GitLab CI. This makes sure the changes work well with the existing code.
- Static Code Analysis − Automated tools check the code for quality, such as linting and security scans.
- Artifact Creation − The code is packaged into deployable artifacts, such as Docker images or JAR files.
- Staging / Pre-Production − The code is deployed to a staging environment. It acts like the production environment for final tests.
- Approval for Production − If the code passes all tests, it is marked as ready for production deployment.
This pipeline helps integrate, build, and prepare code for production with less human effort and more speed.
Tools and Technologies: Git, Jenkins, GitLab, and Others
Many tools are important to set up and manage a Continuous Development pipeline −
- Git − This is the main version control system. It helps us track changes, branch, and collaborate with team members.
- Jenkins − Jenkins is a popular automation server. It works with many tools to automate tasks like building, testing, and deploying code. We can customize Jenkins to support complex workflows.
- GitLab − GitLab is a full DevOps platform. It combines Git version control with built-in CI/CD features. GitLab connects code management with the CI pipeline smoothly.
- CircleCI − CircleCI is a CI/CD platform. It focuses on automating development workflows with scalability and ease of use.
- Travis CI − Travis CI is a cloud-based CI tool. It integrates with GitHub to automate build and deployment tasks.
These tools work together to automate the entire pipeline, from committing code to making it deployment-ready. This ensures we have a smooth and consistent development process.
Automating Code Compilation and Build Process
Automation in Continuous Development helps remove manual steps. This saves time and reduces mistakes. The code compilation and build process is one of the most important parts to automate. The steps usually include −
- Code Compilation − The source code is automatically compiled into executable code or libraries.
- Build Automation − We use tools like Maven (for Java), Gradle, or npm (for JavaScript) to package the code into deployable artifacts.
- Artifact Management − Tools like Nexus or Artifactory store and manage these build artifacts. This makes it easy to access them when we need to deploy.
By automating these steps, we make sure that every code change is built and tested automatically. This keeps everything consistent and removes the chance of human error.
Setting Up Automated Builds with Jenkins
Jenkins is a well-known automation tool for managing Continuous Development pipelines. Here is how we can set up an automated build in Jenkins:
Install Jenkins − Download Jenkins from jenkins.io. Install it on a server or run it as a container.
Create a New Job: In Jenkins, click on "New Item", name the job, and choose "Freestyle project". Click OK to create the job.
Connect to the Git Repository: Under the Source Code Management section, choose Git. Enter the repository URL and authentication details if required. For example,
Repository URL: https://github.com/yourrepo/yourproject.git
Credentials: your-credentials-id
Define Build Steps − In the Build section, add a build step to compile the code using a build tool. For example, for a Maven project, it would be like this −
mvn clean install
Post-Build Actions − We can define post-build actions like archiving the build artifacts or running deployment scripts. For example,
Archive Artifacts: target/*.jar
Schedule or Trigger Builds − We can set triggers to run the build. This could be on code push (using Git webhooks) or on a schedule.
Example − Build on code changes
Build Triggers: GitHub hook trigger for GITScm polling
Once the setup is done, Jenkins will automatically build the code whenever changes are made. This makes sure the build process stays consistent and reliable without us having to do it manually.
Streamlining Continuous Development: Best Practices, Tools, and Strategies
The following table highlights the best practices, the tools, and the strategies applied in streamlining Continuous Development −
| Topic | Details | Example |
|---|---|---|
| Managing Frequent Code Changes and Updates | We handle frequent changes by having clear workflows, automating integration, and reducing conflicts. | We can use feature branches to work on new features. Merge requests help us integrate changes without affecting the main codebase. |
| Using Feature Branches and Merge Requests for Continuous Development | Developers work in separate branches and use merge requests to review and merge code. | Git Example − git checkout -b feature/new-feature creates a new branch. Later, we can create a merge request to integrate the changes. |
| Optimizing Collaboration and Communication | We make communication faster and more efficient to get quality feedback quickly. | Tools − Slack for chatting, Jira for tracking tasks, GitHub for pull requests, ensuring smooth feedback, and task updates. |
| Integrating Developer and Operations Teams for Faster Feedback | Devs and ops teams collaborate easily to get feedback quickly and release faster. | We can use Slack channels to keep both teams updated and work together to solve problems in real time. |
| Version Control Best Practices for Continuous Development | We follow clear workflows to manage code changes and avoid conflicts. | Git Example − Developers should commit and push code regularly to the shared repository. This helps avoid integration hell. |
| Branching Strategies − GitFlow vs. Trunk-Based Development | GitFlow uses branches for features, releases, and fixes. Trunk-based focuses on regular updates to the main branch. | GitFlow Example − Branches like feature/xyz, release/1.2, and hotfix/urgent-fix. Trunk-Based Example: Regularly commit directly to the main branch. |
| Using Git for Managing Multiple Features in Parallel | We can develop features at the same time without breaking things by using different branches. | Developers create separate branches for each feature: git checkout -b feature/xyz for Feature XYZ, making sure no ones work interferes with others. |
| Handling Large-Scale Codebases with Efficient Development Pipelines | We handle large projects by optimizing builds and integration pipelines. | We can use parallel builds to speed up the build process. Incremental builds compile only changed files, not the whole codebase. |
| Parallelizing Builds for Faster Development Cycles | We speed up the development by running tasks like tests and builds at the same time. | In Jenkins, we use the parallel block to run multiple test jobs at once, making the build process faster. |
Conclusion
In this chapter, we explored key ideas and best practices for making Continuous Development easier. We focused on managing frequent code changes, improving collaboration, and using version control in a good way. We talked about how tools like Git, Jenkins, and Slack help us get faster feedback, smoother integrations, and more efficient workflows.
By using strategies like feature branches, merge requests, and branching models such as GitFlow or trunk-based development, we can make development cycles faster and more scalable. These practices help us maintain high-quality, continuous delivery. They also reduce friction and improve collaboration between development and operations teams.
DevOps - Continuous Integration
Continuous Integration (CI) is a key part of DevOps. It means developers merge their code changes into a shared repository many times in a day. Every integration starts an automated build and test process. This helps to catch errors early in the development process. The goal is to fix bugs faster, improve software quality, and keep the product always ready to deploy.
What is Continuous Integration (CI)?
CI makes it easy to combine code changes from many contributors in one project. Tools like Jenkins, GitLab CI/CD, and GitHub Actions help set up pipelines for building, testing, and checking code.
For example, in a Git-based project, a developer commits their code to a branch. CI tools then automatically compile the code, run tests, and give feedback about the changes.
Why do we need Continuous Integration in SDLC?
CI is important for smooth teamwork among developers. It solves "integration hell," where merging code from different developers causes big conflicts or bugs.
With CI, teams can carry out the following −
- Find Issues Early − Automated builds and tests catch problems like syntax errors or failed tests quickly. For example, if a developer adds code with a failing unit test, then CI pipeline finds the problem and stops the broken code from reaching others.
- Avoid Merge Conflicts − Regular integrations reduce the chances of conflicts in code.
- Speed up Delivery − Automation reduces manual work, so releases happen faster. For example, a CI pipeline compiles code, tests it, and creates a deployment package in less than 10 minutes.
By using CI, teams can create better software and work faster in their Software Development Life Cycle (SDLC).
Key Concepts of Continuous Integration
Continuous Integration is based on some key ideas. These ideas make sure the development process is smooth and automated. Let's go through them.
Version Control System (VCS) and CI
A Version Control System (VCS) like Git, Subversion, or Mercurial helps track code changes. CI pipelines work with VCS to watch code repositories for new commits or pull requests. When something changes, the pipeline runs automatically.
Example
In Git, a branch-like feature/new-login gets merged into the main branch. The CI tool notices this and starts the pipeline.
Configuration (GitHub Actions YAML) −
on:
  push:
    branches:
      - main
This setup makes sure every change is checked before being added to the main branch.
Automated Builds
Automated builds turn source code into executable binaries or artifacts. This step checks if the code has syntax errors or unresolved dependencies.
Example
A Node.js project using Jenkins can automate the build process.
Script (Jenkinsfile) −
pipeline {
   stages {
      stage('Build') {
         steps {
            sh 'npm install'
            sh 'npm run build'
         }
      }
   }
}
This script installs dependencies and creates a production-ready build.
Automated Testing
CI includes automated tests to check if the code meets predefined rules. These can include unit tests, integration tests, or functional tests.
Example
A Python project running unit tests using pytest.
GitLab CI/CD YAML −
test:
  stage: test
  script:
    - pip install -r requirements.txt
    - pytest
If any test fails, the pipeline stops. This prevents faulty code from going further.
CI Pipeline and its Components
A CI pipeline automates the whole process. It has several important parts −
- Trigger − Events like commits, merges, or pull requests. Example trigger: on: push in GitHub Actions.
- Stages − Steps like build, test, and deploy.
- Jobs − Tasks inside each stage, such as running tests.
- Artifacts − Outputs like logs or build files.
- Notifications − Messages to developers when something passes or fails.
Example
Jenkinsfile for a CI pipeline −
pipeline {
   agent any
   stages {
      stage('Build') {
         steps {
            sh 'mvn package'
         }
      }
      stage('Test') {
         steps {
            sh 'mvn test'
         }
      }
   }
   post {
      always {
         mail to: 'team@example.com',
         subject: "Pipeline ${currentBuild.result}",
         body: "Pipeline completed with status: ${currentBuild.result}"
      }
   }
}
Each part of the pipeline ensures code changes are properly tested and ready to deploy.
CI Tool Example: Jenkins
Jenkins is one of the most popular tools for Continuous Integration (CI). Its open-source and supports many plugins for building, testing, and deploying apps. We can easily set it up and start automating our workflows.
Installing and Configuring Jenkins
Installation − Install Jenkins on your system or server. For Ubuntu, follow these steps −
sudo apt update
sudo apt install openjdk-11-jre
wget -q -O - https://pkg.jenkins.io/debian-stable/jenkins.io.key | sudo apt-key add -
sudo sh -c 'echo deb http://pkg.jenkins.io/debian-stable binary/ > /etc/apt/sources.list.d/jenkins.list'
sudo apt update
sudo apt install jenkins
Open Jenkins in your browser at http://<your-server-ip>:8080.
Initial Configuration: Get the admin password −
sudo cat /var/lib/jenkins/secrets/initialAdminPassword
Log in to Jenkins, install the suggested plugins, and create an admin user.
Integrating Git − Go to Manage Jenkins > Plugin Manager. Install the Git plugin. Configure your Git repository under Manage Jenkins > Global Tool Configuration.
Setting Up a Basic Jenkins Pipeline
Create a new pipeline job. Click on New Item > Pipeline > OK.
Add the pipeline script to the job configuration. Use this script in the Pipeline section:
pipeline {
   agent any
   stages {
      stage('Clone Repository') {
         steps {
           git 'https://github.com/your-repo/sample-app.git'
         }
      }
   }
}
This will clone your repository every time the pipeline runs.
Adding Stages: Build, Test, and Deploy
We can improve the pipeline by adding stages for building, testing, and deploying our app.
Jenkinsfile Example
pipeline {
   agent any
   stages {
      stage('Clone Repository') {
         steps {
            git 'https://github.com/your-repo/sample-app.git'
         }
      }
      stage('Build') {
         steps {
            sh './build.sh' // or your build command
         }
      }
      stage('Test') {
         steps {
            sh './run-tests.sh' // Run unit tests
         }
      }
      stage('Deploy') {
         steps {
            sh './deploy.sh' // Deploy to staging
         }
      }
   }
   post {
      success {
         echo 'Pipeline completed successfully.'
      }
      failure {
         echo 'Pipeline failed.'
      }
   }
}
Important Configurations:
- Update ./build.sh, ./run-tests.sh, and ./deploy.sh with your project-specific commands.
- Use plugins like Email Extension to send notifications to the team.
This Jenkins pipeline automates code integration. It ensures quality through testing and helps deploy apps efficiently. It follows CI principles perfectly and makes the development process smoother.
Best Practices in Continuous Integration
The following table summarizes some of the best practices in Continuous Integration −
| Practice | Description | Example / Configuration |
|---|---|---|
| Commit Early and Often | We should commit small and regular changes to the main branch. This avoids large conflicts and makes integration easier. | Use branch protection in GitHub. Enforce frequent pull requests and reviews. |
| Keeping Builds Fast | Make sure CI pipelines run quickly. This gives fast feedback to developers and keeps the workflow smooth. | Cache dependencies in Jenkins or GitLab. Use Docker layers or build cache for optimization. |
| Handling Build Failures | Build failures must stop the pipeline immediately. Fix issues quickly to keep the codebase stable. | Set Jenkins to fail builds on test errors: pipeline { post { failure { sh 'notify.sh' } } } |
| Continuous Feedback Loops | We should notify all team members, like developers and QA, about pipeline status. Automated alerts help keep everyone updated. | Use Jenkins Email or Slack plugins to send notifications about pipeline results after every run. |
Challenges in Continuous Integration
The following table highlights the challenges that developers have to face while implementing Continuous Integration and also the solutions to overcome these challenges −
| Challenge | Description | Solution |
|---|---|---|
| Managing Merge Conflicts | Multiple developers committing often can create conflicts. This is common in large teams working on the same codebase. | Do regular code reviews. Use rebasing to reduce conflicts before merging changes. |
| Scaling CI for Large Teams | Big teams mean more builds and tests running at the same time. This can overload the CI system if its not prepared. | Use distributed build agents in Jenkins. GitLab runners with auto-scaling also handle this well. |
| Balancing Speed and Reliability | Quick feedback is important. But if we skip tests or compromise build quality, it can cause problems in production. | Use parallel pipelines. This makes testing thorough without slowing down execution too much. |
Conclusion
In this chapter, we looked at the main ideas of Continuous Integration (CI). We talked about how important CI is in the Software Development Life Cycle (SDLC). We also covered key practices like committing code often, using automated builds, and testing. We then discussed how CI pipelines are structured.
We also explored Jenkins as a practical CI tool. We looked at best practices that help improve CI processes. Lastly, we talked about common problems, like merge conflicts and scaling CI for large teams.
By using these methods, teams can speed up delivery, improve code quality, and work better together. This will help create a strong and efficient software development process.
DevOps - Continuous Testing
Continuous Testing means running tests automatically during the software delivery process. It gives quick feedback on the software's quality. This helps us find and fix issues early, making development faster and more efficient.
What is Continuous Testing in DevOps?
In DevOps, Continuous Testing is built into every step of the CI/CD pipeline. It checks if code changes meet quality standards before moving to the next stage.
The main parts of Continuous Testing are:
- Automation − We automate repeatable test tasks to make them faster and more reliable.
- Integration − It works smoothly with CI/CD tools like Jenkins, GitLab, or CircleCI.
- Feedback Loops − Developers and stakeholders get real-time updates on the test results.
Following are the benefits of Continuous Testing in DevOps −
- Early bug detection − Find issues early, before production.
- Faster Time-to-Market − Speeds up development and delivery.
- Improved Code Quality − Keeps testing standards consistent.
Why Do We Need Continuous Testing in DevOps?
Continuous Testing is super important in DevOps because it supports quick and repeated development cycles. Here's why −
- Reduced Risk − It finds bugs early. This lowers the chance of big problems in production.
- Faster Delivery − Automated tests save time, helping us release software faster without losing quality.
- Enhanced Collaboration − It connects testing with development. This helps developers, testers, and operations teams work together better.
- Better Customer Experience − Fixing issues early ensures stable and reliable applications for users.
By adding testing to every step of the DevOps process, we can keep up with the fast pace of modern software development while keeping quality high.
Key Components of Continuous Testing
Continuous Testing depends on three main things. These are automation tools for testing, environments that match production, and integration with CI/CD pipelines for smooth workflows.
Test Automation Tools
Test automation tools make repetitive and complex testing easy. They help us get faster and more reliable results.
Popular Test Automation Tools include the following −
- Selenium − Automates browser actions for functional testing.
- JUnit/TestNG − Helps in unit and regression testing for Java apps.
- Postman − Makes API testing simple with collections and scripts.
- Cypress − Focuses on end-to-end tests for modern web apps.
Test Environments and Infrastructure
Good test environments and scalable infrastructure are very important. They make sure our tests act like they would in real life.
- Containerization − Tools like Docker give the same environment for both development and testing.
- Cloud-Based Environments − Services like AWS Device Farm or BrowserStack let us test on different devices and operating systems.
- Infrastructure as Code (IaC) − Tools like Terraform help us create and manage testing setups with code.
Keep the test environments similar to production settings. Update the environments often to match new dependencies and versions.
Integration with CI / CD Pipelines
Continuous Testing works best when it's part of CI/CD workflows. It ensures quality checks happen at every step of software delivery.
This is how it works −
- Tests run automatically whenever code is committed or built.
- If a test fails, the pipeline stops right away, and developers get quick feedback.
- Tools like Jenkins, GitLab CI, and Azure DevOps make the process easier.
Run tests at the same time to save time. Use different pipelines for unit, integration, and performance tests. Automate test reports for better tracking and accountability.
These components together help us deliver software faster, with less risk and better quality.
Setting Up Continuous Testing in DevOps
We use Continuous Testing to check quality at every stage of the DevOps lifecycle. Setting it up involves making a strong framework, picking the right tools, and smoothly adding testing to the CI/CD workflow. Lets break it down step by step.
Step 1. Preparing the Test Framework
The test framework is like the base. It helps us automate and manage tests. Here are the steps to be followed –
- Define What to Test − Decide which tests (unit, integration, or performance) to automate.
- Pick a Framework − Choose a framework that matches your language and test type. For example: Use JUnit for Java unit tests. Use PyTest for Python.
- Set It Up − Organize the folders and install the dependencies.
Example of Maven pom.xml for JUnit −
<dependencies>
    <dependency>
        <groupId>junit</groupId>
        <artifactId>junit</artifactId>
        <version>4.13.2</version>
        <scope>test</scope>
    </dependency>
</dependencies>
Make a modular structure to reuse test cases. Add logs and reports to debug faster.
Step 2. Selecting the Right Testing Tools
We must pick tools that fit the project needs and work with DevOps processes.
- Know the Needs − For UI tests, try Selenium or Cypress. For API tests, go with Postman or Rest-Assured.
- Check Tool Compatibility − Make sure tools work with CI/CD systems like Jenkins or GitLab. Then, set up the tool.
Example: Add Selenium to a Java project −
<dependency>
    <groupId>org.seleniumhq.selenium</groupId>
    <artifactId>selenium-java</artifactId>
    <version>4.1.0</version>
</dependency>
Install drivers and set up browser settings.
Pick tools that support parallel runs to save time. Make sure tools can handle more test cases as the project grows.
Step 3. Integrating Testing into the DevOps Workflow
To make testing smooth, we need to connect it with the CI / CD pipeline. First, add testing to CI / CD. Take a look at the following example −
Example Jenkins pipeline −
pipeline {
    agent any
    stages {
        stage('Build') {
            steps {
                sh 'mvn clean package'
            }
        }
        stage('Test') {
            steps {
                sh 'mvn test'
            }
        }
    }
}
Set Triggers − Run tests whenever there is a code commit or pull request.
Create Reports − Use plugins like Allure or built-in tools to see test results clearly.
Run small tests (like unit tests) on every commit. Run big tests (like performance) less often. Keep an eye on how fast tests are and make pipelines better.
Types of Continuous Testing
The following table summarizes the types of Continuous Testing −
| Test Type | Description | Examples |
|---|---|---|
| Unit Testing | We test individual components or methods to make sure they work correctly. |
|
| Integration Testing | We check how components or services work together. This makes sure data flows correctly and communication happens as expected. |
|
| Functional Testing | We test the features of the application to make sure they meet the requirements. This is done through user workflows. |
|
| Performance and Load Testing | We test the system to see how it performs under normal and heavy traffic to make sure it can handle many users. |
|
| Security Testing | We focus on finding security problems like vulnerabilities and threats. This makes sure the application is safe from attacks. |
|
Implementing Test Automation
We can improve the testing process by implementing test automation in the DevOps pipeline. This helps speed up and make software delivery more reliable. The process includes writing automated test scripts, managing test cases and data, and running tests automatically as part of the CI/CD pipeline.
Writing Automated Test Scripts
Writing automated test scripts is important for testing the application without human help. These tests make sure the code works as expected after each update or change.
Following are the tools needed for writing automated test scripts −
- Selenium for testing the UI in browsers.
- JUnit or TestNG for unit testing in Java applications.
- PyTest for Python applications.
Make sure scripts are clear, reusable, and easy to maintain. Use Page Object Model (POM) for UI tests to keep scripts easier to manage.
Example (JUnit test for a calculator app) −
@Test
public void testAddition() {
    Calculator calc = new Calculator();
    int result = calc.add(2, 3);
    assertEquals(5, result);
}
Managing Test Cases and Data
We need to manage test cases and data properly for a scalable test suite. This involves organizing test cases, managing test data, and making sure test environments are consistent across all test executions.
Test Case Management − Use tools like TestRail or Jira to organize and track test cases.
Test Data Management − Store the test data in configuration files or databases. Use tools like Mockaroo or Factory Boy to generate dynamic test data.
Example (YAML configuration for test data in a test case) −
test_data:
  - input: "2, 3"
    expected_output: "5"
  - input: "4, 5"
    expected_output: "9"
Triggering Tests Automatically
We can run tests automatically as part of the CI/CD pipeline. This way, tests run every time there's a code change, giving quick feedback to developers.
CI/CD Integration: Integrate tests into CI/CD tools like Jenkins, GitLab CI, or Azure DevOps.
Example (Jenkins pipeline configuration for triggering tests) −
pipeline {
    agent any
    stages {
        stage('Build') {
            steps {
                sh 'mvn clean package'
            }
        }
        stage('Test') {
            steps {
                sh 'mvn test'
            }
        }
    }
}
Triggering on Commit − Set up the pipeline to trigger tests automatically on every commit or pull request.
Scheduled Runs − Use tools like Cron or built-in Jenkins features to run tests regularly and make sure new code changes don't cause issues.
By automating these steps, we make test execution faster and more reliable. This helps improve the efficiency and quality of the development pipeline.
Best Practices and Challenges in Continuous Testing
The following table highlights the best practices and challenges in Continuous Testing −
| Category | Best Practices / Challenges | Description / Examples |
|---|---|---|
| Best Practices for Continuous Testing | Shift-Left Testing Strategy | We should start testing early in the development lifecycle. The earlier we find bugs, the cheaper they are to fix. Example: Write unit tests during the design phase. |
| Testing Early and Often | Its important to run tests continuously at each stage of the SDLC, including after code commits and every build. Example: Use Jenkins to trigger unit tests on every pull request. |
|
| Parallel Testing for Speed Optimization | Run tests in parallel to make the testing process faster. Example: Use Selenium Grid or JUnits parallel execution feature to run multiple tests at once across different environments. |
|
| Continuous Feedback Loops | We need to provide quick feedback to developers on test results, so they can fix issues fast. Example: Configure Jenkins to notify the team immediately if tests fail during integration or deployment. |
|
| Challenges in Continuous Testing | Test Flakiness | Tests that give different results each time. Example: A test might pass on a developers computer but fail in the CI environment because of environment differences. |
| Scalability of Test Suites | As the number of tests grows, it gets harder to manage and slower to run. Example: Managing thousands of integration tests in large applications may need breaking tests into smaller parts and improving performance. |
|
| Maintaining Test Environments | Keeping the test environment similar to the production environment is a common issue. Example: Automate setting up test environments using containerization tools like Docker. |
Conclusion
In this chapter, we talked about key points of Continuous Testing in DevOps. We covered its importance, main parts, and steps to implement it. We discussed test automation, managing test cases and data, and adding testing into the CI/CD pipeline.
We also looked at common problems like test flakiness, scalability issues, and keeping test environments consistent. By using these strategies, teams can improve the speed, reliability, and efficiency of software delivery. This helps in creating better products in a faster development cycle.
DevOps - Continuous Delivery
Continuous Delivery (CD) is a software development practice. It focuses on automating how code changes are delivered to environments that are similar to production. The main goal is to keep the code ready for deployment all the time. This allows for more frequent releases. CD builds on Continuous Integration (CI) by automating the release process. But it stops before the code is deployed directly to production.
In a typical CD pipeline, automated tests, build processes, and staging environments make sure the software is always ready to be deployed. CD is very important in DevOps. It helps to release software quickly, reliably, and often. It also improves how development and operations teams work together.
Difference between Continuous Deployment (CI) and Continuous Delivery (CD)
Both Continuous Integration (CI) and Continuous Delivery (CD) help improve the software release process. But they are different in a few ways −
- Continuous Integration (CI) − CI is about merging code changes into the main codebase often. It runs automated tests to make sure the software is always in a working state. CI doesn't release software to production automatically.
- Continuous Delivery (CD) − CD builds on CI. It automates the deployment process to environments that are similar to production. CD ensures every change passing automated tests is ready for production. But it doesn't deploy automatically.
The main difference is in the last step. CI focuses on integration and testing. CD automates the release process, but human approval might still be needed for deployment to production.
Why do we need Continuous Delivery in a DevOps Environment?
Continuous Delivery is important in DevOps for many reasons −
- Faster Releases: − Automating the release process makes it faster for code to go from development to production. This allows for quicker and more frequent releases.
- Improved Quality − With automated testing and deployment, CD makes sure only tested code reaches production. This reduces errors and defects.
- Better Collaboration − CD helps development and operations teams work better together. It makes the handoff from development to deployment smoother.
- Less Manual Work − Automating deployment steps lowers the chances of human mistakes. This makes the process more reliable.
- Scalability − CD helps organizations grow their delivery processes. As teams and applications grow, CD supports faster changes and more innovation.
In short, CD helps DevOps teams deliver value faster, with better quality and less risk. It is a key part of modern software development.
Building a Continuous Delivery Pipeline
A Continuous Delivery (CD) pipeline automates the process of moving code from development to production. The pipeline has several stages like building, testing, deploying, and monitoring.
The goal is to make sure the code is always ready for production in an automated and reliable way. A CD pipeline includes important parts like version control, build automation, automated testing, deployment automation, and monitoring tools.
Key stages usually include the following:
- Source − Fetching the code from the version control system (VCS).
- Build − Compiling the code, solving dependencies, and creating deployable artifacts.
- Test − Running automated tests to check the quality and correctness of the code.
- Deploy − Deploying the application to staging or production environments.
- Monitor − Ensuring the application is running well after deployment.
Designing and Structuring a Continuous Delivery Pipeline
A good CD pipeline breaks the process into stages, each with its job. Here’s how a typical pipeline is set up −
Source Stage − This is the first stage. The pipeline starts when changes are pushed to the version control system (e.g., Git). It fetches the latest code from the repository. Take a look at the following example −
git:
  branch: master
  repository: https://github.com/your-repo.git
Build Stage − The build stage compiles the code, fixes dependencies, and generates artifacts (e.g., JAR, WAR files). Tools like Maven, Gradle, or npm are used here.
Example (Maven build) −
$ mvn clean install
Test Stage − Automated tests (unit tests, integration tests) run to check the code. This stage makes sure new changes don't break anything.
Example (JUnit test command) −
$ mvn test
Deploy Stage − This stage automates the deployment of the application to a staging or production environment. Docker, Kubernetes, or Ansible are often used.
Example (Deploying with Docker) −
docker build -t myapp .
docker run -d myapp
Monitor Stage − After deployment, monitoring tools (e.g., Prometheus, Grafana) check the applications health and performance to make sure it works fine.
Integrating Version Control, Build Automation, and Deployment Tools
A CD pipeline uses several tools that work together to automate the delivery process:
Version Control − Git is commonly used for source code management. Every change is tracked in the repository, which starts the pipeline.
Example configuration for Git in Jenkins −
pipeline {
   agent any
   stages {
      stage('Checkout') {
         steps {
            git branch: 'master', url: 'https://github.com/your-repo.git'
         }
      }
   }
}
Build Automation − Tools like Maven, Gradle, or npm handle compiling and packaging the code into deployable artifacts.
Example (Gradle build in Jenkins) −
pipeline {
   agent any
   stages {
      stage('Build') {
         steps {
            script {
               sh 'gradle build'
            }
         }
      }
   }
}
Deployment Tools − Tools like Docker, Kubernetes, or AWS CodeDeploy automate the deployment to different environments. Docker can be used to containerize the app, making sure it works the same in any environment.
Example (Docker deployment using Jenkins) −
pipeline {
   agent any
   stages {
      stage('Deploy') {
         steps {
            script {
               sh 'docker build -t myapp .'
               sh 'docker run -d -p 8080:8080 myapp'
            }
         }
      }
   }
}
Automation of Build and Test Stages using Jenkins, GitLab CI, or CircleCI
Automating build and test stages is important for a smooth Continuous Delivery process. Tools like Jenkins, GitLab CI, and CircleCI can automate these steps, reducing manual work and ensuring consistency.
Jenkins − Jenkins is a widely used CI/CD tool. It automates the build and test processes and integrates with tools like Git, Maven, Docker, and Kubernetes.
Example (Jenkins pipeline for build and test) −
pipeline {
   agent any
   stages {
      stage('Build') {
         steps {
            script {
               sh 'mvn clean install'
            }
         }
       }
       stage('Test') {
          steps {
             script {
                sh 'mvn test'
             }
          }
       }
   }
}
GitLab CI − GitLab CI offers an integrated CI/CD pipeline that runs jobs automatically based on Git pushes. It uses a .gitlab-ci.yml file for configuration.
Example (GitLab CI pipeline for build and test) −
stages:
  - build
  - test
build:
  stage: build
  script:
    - mvn clean install
test:
  stage: test
  script:
    - mvn test
CircleCI − CircleCI is a cloud-based CI/CD service that integrates with version control systems like GitHub. It uses a .circleci/config.yml file for configuration.
Example (CircleCI pipeline for build and test) −
version: 2.1
jobs:
  build:
    docker:
      - image: circleci/python:3.8
    steps:
      - checkout
      - run:
          name: Install dependencies
          command: pip install -r requirements.txt
      - run:
          name: Run tests
          command: pytest
workflows:
  version: 2
  build_and_test:
    jobs:
      - build
These tools fit smoothly into the pipeline. They help automate build, test, and deployment, reducing the risk of errors and speeding up software delivery.
Key Points to Remember in Continuous Delivery
The following table highlights the key points to note in Continuous Delivery −
| Topic | Points to Remember | Explanations | Examples |
|---|---|---|---|
| Importance of Automation |
|
|
|
| Automated Testing in Continuous Delivery |
|
|
|
| Containerization and CD: Docker & Kubernetes |
|
|
|
| Deploying to Multiple Environments with CD |
|
|
IaC tools like Terraform and Ansible for configuration and deployment. |
| Blue-Green and Canary Deployments in Continuous Delivery |
|
|
|
| CI/CD Toolchains and Integrations |
|
|
|
| Security in Continuous Delivery |
|
|
|
| Monitoring and Observability in CD Pipelines |
|
|
|
| Scaling Continuous Delivery for Large Teams and Enterprises |
|
|
|
| CD and Feature Toggles: Managing Features and Releases |
|
|
|
| Automating Rollbacks and Handling Failures in CD |
|
|
|
| Advanced Continuous Delivery: Self-Healing Pipelines |
|
|
|
Conclusion
In this chapter, we looked at the main parts of Continuous Delivery (CD). We talked about important topics like automated testing, containerization with Docker and Kubernetes, blue-green and canary deployments, security practices, and scaling for big teams. We also discussed how to integrate CI/CD tools, manage feature toggles, handle automated rollbacks, and explore advanced ideas like self-healing pipelines.
By understanding these methods and tools, we can make our workflows smoother, improve deployment reliability, create better releases, and reduce manual work. This helps us build a stronger and more efficient DevOps pipeline.
DevOps - Continuous Deployment
Continuous Deployment (CD) is an advanced part of the DevOps pipeline. It automatically pushes validated changes from version control straight to production. Theres no need for manual approval in this process. Unlike Continuous Delivery, which waits for human approval, Continuous Deployment uses automation to ensure faster releases.
Key Features of Continuous Deployment
Following are the key features Continuous Deployment −
- Fully automated processes for building, testing, and deploying code.
- Strong testing and validation mechanisms like unit, integration, and performance testing.
- Tools and scripts that can handle infrastructure and application updates smoothly.
Continuous Deployment vs. Continuous Integration vs. Continuous Delivery
The following table highlights the key differences among Continuous Deployment, Continuous Integration, and Continuous Delivery −
| Aspect | Continuous Integration | Continuous Delivery | Continuous Deployment |
|---|---|---|---|
| Definition | Automates code changes into a shared repository. | Keeps code always ready for release after passing tests. | Fully automates code deployment to production, no manual step needed. |
| Focus Area | Code merging and testing. | Prepares builds for deployment. | Automates deployment to production. |
| Automation Level | Partly automated (builds and tests). | Almost fully automated, but with manual approval for production. | Fully automated deployment end-to-end. |
| Key Activities |
|
|
|
| Tools | Jenkins, GitHub Actions, GitLab CI/CD, CircleCI. | ArgoCD, Spinnaker, AWS CodePipeline. | Kubernetes, Terraform, Jenkins (with plugins), GitOps tools. |
| Risk Level | Low, since it focuses on testing and code merging. | Moderate, as production releases need manual approval. | High, as deployments go straight to production without human checks. |
| Benefits |
|
|
|
| Challenges |
|
|
|
Setting Up a Continuous Deployment Pipeline
We can set up a Continuous Deployment (CD) pipeline by automating the process of building, testing, and deploying code. Let's go step by step to create this workflow.
Step 1: Choose and Configure a Version Control System (VCS)
A Version Control System like Git helps us manage code changes. When developers push their updates to the repository, the CD pipeline starts automatically.
Example: Create a new GitHub repository −
# Initialize a Git repository locally
git init

# Add a remote repository
git remote add origin https://github.com/user/project.git

# Commit and push code
git add .
git commit -m "Initial commit"
git push -u origin main
We can connect this repository to a CI/CD tool like Jenkins or GitHub Actions using webhooks.
Step 2: Set Up a CI / CD Tool
We need a CI/CD tool like GitHub Actions, Jenkins, or GitLab CI/CD. This tool automates steps like building, testing, and deploying.
Example: (GitHub Actions Configuration)
Create a .github/workflows/deployment.yml file in the repository −
name: CI/CD Pipeline
on:
  push:
    branches:
      - main
jobs:
  build:
    runs-on: ubuntu-latest
    steps:
      - name: Checkout Code
        uses: actions/checkout@v2
      - name: Set up Node.js
        uses: actions/setup-node@v3
        with:
          node-version: 16
      - name: Install Dependencies
        run: npm install
      - name: Run Tests
        run: npm test
      - name: Build Application
        run: npm run build
  deploy:
    needs: build
    runs-on: ubuntu-latest
    steps:
      - name: Deploy to Server
        run: |
          scp -r ./build user@your-server:/var/www/app
This pipeline does two things −
- It builds and tests the app every time we push code to the main
- It deploys the app to a server using scp.
Step 3: Automate Testing
Automated testing is important to ensure the code is stable. We can add unit tests, integration tests, and end-to-end tests.
Example (Jest for Unit Tests)
Add a test script to package.json −
"scripts": {
  "test": "jest"
}
Run these tests automatically in the pipeline using −
npm test
Step 4: Configure Deployment Automation
Deployment automation helps move tested code to production without manual steps. Tools like Terraform make this process smooth.
Example (Terraform for AWS Deployment) −
provider "aws" {
   region = "us-west-2"
}
resource "aws_s3_bucket" "static_site" {
   bucket = "my-static-site"
   acl    = "public-read"
}
resource "aws_s3_bucket_object" "index" {
   bucket = aws_s3_bucket.static_site.bucket
   key    = "index.html"
   source = "build/index.html"
   content_type = "text/html"
}
Run Terraform commands to deploy −
terraform init
terraform apply
Step 5: Integrate Infrastructure as Code (IaC)
IaC tools like Kubernetes help us manage environments.
Example (Kubernetes Deployment) −
Write a deployment.yaml file −
apiVersion: apps/v1
kind: Deployment
metadata:
  name: app-deployment
spec:
  replicas: 3
  selector:
    matchLabels:
      app: my-app
  template:
    metadata:
      labels:
        app: my-app
    spec:
      containers:
      - name: app
        image: my-app-image:latest
        ports:
        - containerPort: 80
Apply this configuration.
kubectl apply -f deployment.yaml
Step 6: Implement Monitoring and Feedback Loops
We need monitoring tools to check the app's performance. Tools like Prometheus and Grafana are helpful.
Example (Prometheus Configuration) −
scrape_configs:
  - job_name: "app"
    static_configs:
      - targets: ["localhost:9090"]
Step 7: Test the End-to-End Pipeline
Finally, push changes to the repository and make sure everything works:
- Build − Compiles the application.
- Test − Runs tests to find issues.
- Deploy − Pushes the app to the server.
By combining version control, CI/CD tools, testing, and IaC, we can make sure our pipeline is smooth and reliable. This helps deliver updates faster and with fewer errors.
Implementing Deployment Strategies
The following table highlights the continuous deployment strategies in DevOps −
| Deployment Strategy | Description | Use Case / Benefit |
|---|---|---|
| Blue-Green Deployments | Blue-Green deployment uses two environments (blue and green). One environment (blue) runs the current version of the app, and the other (green) runs the new version. When the new version is ready, we switch the traffic to green. The blue environment stays for rollback if needed. | This method helps avoid downtime during deployment. It is great for apps that need zero downtime and fast rollback. It also ensures both environments are the same for reliable testing. |
| Canary Releases | Canary releases roll out the new version to a small group of users first. We monitor the performance and issues of the new version. If everything works fine, we release it to more users. | This helps reduce risk. It lets us test the new version on a small group before going live. It's good for features that need testing in real user conditions. |
| Rolling Updates | Rolling updates update the application on a few servers at a time. This ensures that some servers are always running the app. As we deploy new versions, old ones are gradually shut down. We continue this until all servers are updated. | This strategy reduces the risk of downtime. It's helpful when we need non-stop deployment, especially for apps that need to be always available. |
| Feature Toggles and Flags | Feature toggles (or feature flags) allow us to turn features on or off in the codebase without redeploying. It helps us release incomplete or experimental features and control them dynamically. | This is useful for turning features on/off quickly without deployment. It helps in A/B testing, managing feature rollouts, and working on different versions of features at the same time. |
Conclusion
In this chapter, we explained how to set up reliable deployment pipelines. We also looked at strategies like Blue-Green and Canary Releases. We discussed how to ensure security and compliance using automated scans and vulnerability checks.
By using these techniques and tools, development teams can make deployment processes smoother, reduce downtime, keep security high, and scale applications easily. This will help speed up the software delivery cycle and improve the overall operational performance.
DevOps - Continuous Monitoring
Continuous Monitoring (CM) in DevOps means watching, tracking, and checking metrics of systems, apps, and infrastructure in real-time. The main goal is to keep things running well, find problems early, and fix them before they affect users.
Continuous Monitoring includes the following −
- Collecting logs, metrics, and traces from apps and infrastructure.
- Sending alerts when something crosses a set limit.
- Giving insights into performance, reliability, and security.
Unlike old-school monitoring, CM fits right into the DevOps pipeline. This makes sure feedback loops stay smooth during the software delivery process.
Role of Continuous Monitoring in the DevOps Lifecycle
Continuous Monitoring is important for keeping the DevOps workflow reliable and efficient. It helps in many ways −
- Improving Feedback Loops − Gives teams real-time updates on deployments so they can spot and fix issues faster.
- Enhancing Automation − Works with CI/CD tools to handle things automatically, like rolling back bad deployments or scaling resources.
- Supporting Performance Optimization − Checks how resources are used and how apps perform to make things better.
- Ensuring Security Compliance − Watches for security problems, unauthorized access, and compliance issues in real-time.
By adding monitoring at every step of the DevOps process, we can deliver better software with less downtime and happier users.
Components of Continuous Monitoring
The following table explains in brief the key components of Continuous Monitoring.
| Component | Description | Examples |
|---|---|---|
| Monitoring Tools and Technologies | These tools help us collect, organize, and check performance or operational data. | Prometheus, Nagios, Zabbix, Datadog, Splunk, New Relic |
| Metrics | Measurable data that shows system performance, like CPU and memory usage. | CPU utilization, Memory usage, Latency, Request rates |
| Logs | Logs are event details created by apps, servers, or devices. They give us operational info. | ELK Stack (Elasticsearch, Logstash, Kibana), Fluentd, Graylog |
| Traces | Traces follow the path of requests across services. They're useful for debugging microservices. | Jaeger, Zipkin, OpenTelemetry |
| Alerting and Notification Systems | These systems send alerts when thresholds are crossed. They notify the right teams. | Alertmanager (Prometheus), PagerDuty, Opsgenie, Slack Integrations, Microsoft Teams Notifications |
Monitoring Metrics: What to Measure
When we do Continuous Monitoring, we need to track different metrics. These metrics help us keep systems healthy, make apps run well, and meet business goals. Lets look at the key types of metrics, their importance, and some examples.
System Metrics: CPU, Memory, Disk, and Network Utilization
System metrics show how our infrastructure is performing.
- CPU Utilization − Tells us how much CPU is being used. If it's too high, it can cause performance problems.
- Memory Usage − Tracks used and available memory. Low memory can lead to crashes.
- Disk I/O − Measures read and write speeds. Helps us find storage bottlenecks.
- Network Utilization − Checks bandwidth, data loss, and latency. Makes sure data flows properly.
Example (Prometheus Query)
# CPU Utilization for all nodes
rate(node_cpu_seconds_total{mode!="idle"}[5m])

# Memory Usage
node_memory_MemAvailable_bytes / node_memory_MemTotal_bytes * 100

# Disk Read/Write
rate(node_disk_read_bytes_total[5m]), rate(node_disk_write_bytes_total[5m])
Application Metrics: Request Rates, Response Times, and Error Rates
These metrics ensure apps stay reliable and meet user expectations −
- Request Rates − Tracks how many requests come in every second. Shows workload patterns.
- Response Times − Tells how long it takes to process requests. Important for user experience.
- Error Rates − Tracks failed requests as a percentage. High numbers can mean bugs or overload.
Example (Sample Nginx Configuration)
# Enable logging for response times
log_format timed_combined '$remote_addr - $remote_user [$time_local] "$request" '
                          '$status $body_bytes_sent "$http_referer" '
                          '"$http_user_agent" $request_time';
# Prometheus Exporter (example metric for response times)
http_server_requests_seconds_sum{job="nginx"}
Business Metrics: SLA, SLO, and User Experience Metrics
These metrics connect system performance with business goals.
- SLA (Service Level Agreement) − What we promise customers, like 99.9% uptime.
- SLO (Service Level Objective) − Internal goals to meet SLAs, like keeping response times below 200ms.
- User Experience Metrics − Tracks latency, availability, and error-free interactions.
Example (SLO Configuration using Prometheus and Alertmanager)
# Define SLO for response time
- alert: ResponseTimeHigh
  expr: histogram_quantile(0.99, rate(http_server_requests_seconds_bucket[5m])) > 0.2
  for: 1m
  labels:
    severity: warning
  annotations:
    summary: "High response time detected"
By tracking system, application, and business metrics, we can fix problems faster. This keeps performance smooth and aligns IT with business needs. Tools like Prometheus, Grafana, and Nginx logs make it easier to set up a strong monitoring system.
Setting Up Continuous Monitoring Infrastructure
To set up Continuous Monitoring, we need tools to collect data, show metrics, and send alerts. Below, we go step-by-step to create a complete monitoring system using Prometheus (for monitoring), Grafana (for dashboards), and Alertmanager (for alerts).
Step 1: Install and Configure Prometheus
Prometheus is the main tool for monitoring. It collects metrics from systems and apps.
Prometheus Configuration File (prometheus.yml) −
global:
  scrape_interval: 15s
scrape_configs:
  - job_name: 'node_exporter' # Monitor system metrics
    static_configs:
      - targets: ['localhost:9100']
  - job_name: 'app'
    static_configs:
      - targets: ['localhost:8080'] # Your application metrics endpoint
First, download Prometheus and install it. Then, run Prometheus using the config file −
./prometheus --config.file=prometheus.yml
Step 2: Install Node Exporter for System Metrics
We use Node Exporter to collect system data like CPU and memory usage.
Commands to Install and Start Node Exporter:
wget https://github.com/prometheus/node_exporter/releases/download/v1.6.0/node_exporter-1.6.0.linux-amd64.tar.gz
tar -xvf node_exporter-1.6.0.linux-amd64.tar.gz
./node_exporter &
Step 3: Configure Application Metrics (e.g., Spring Boot)
Our apps need to expose metrics for Prometheus to collect.
Add Micrometer Dependency to pom.xml −
<dependency>
    <groupId>io.micrometer</groupId>
    <artifactId>micrometer-registry-prometheus</artifactId>
</dependency>
Expose Metrics Endpoint in application.properties −
management.endpoints.web.exposure.include=prometheus
management.metrics.export.prometheus.enabled=true
Step 4: Set Up Grafana for Visualization
Grafana helps us view the metrics in charts and dashboards.
- Install Grafana and open it at http://localhost:3000.
- Add Prometheus as the data source.
- Use pre-built dashboards for system and app metrics.
Example Dashboard Query (CPU Usage)
rate(node_cpu_seconds_total{mode!="idle"}[5m])
Step 5: Configure Alerting with Alertmanager
Prometheus works with Alertmanager to send alerts.
Alert Rules in prometheus.yml −
rule_files:
  - "alert_rules.yml"
alerting:
  alertmanagers:
    - static_configs:
        - targets: ['localhost:9093']
Example alert_rules.yml
groups:
  - name: system_alerts
    rules:
      - alert: HighCPUUsage
        expr: avg(rate(node_cpu_seconds_total[2m])) > 0.8
        for: 2m
        labels:
          severity: critical
        annotations:
          summary: "High CPU Usage Detected"
Run Alertmanager −
./alertmanager --config.file=alertmanager.yml
Step 6: Verify and Test the Setup
Check System Metrics like CPU and memory in Grafana. View App Metrics like request rates and error counts. Test Alerts by creating high CPU loads.
With this setup, we have a strong monitoring system. Prometheus collects data, Grafana shows dashboards, and Alertmanager sends alerts. This helps DevOps teams track performance and quickly handle any issues.
Logging and Distributed Tracing
Logging and distributed tracing are very important for finding problems, improving performance, and keeping track of what happens in microservices. Below is a simple guide for setting up centralized logging and distributed tracing. We will also show how to configure log aggregation and trace sampling.
Centralized Logging Solutions (e.g., ELK Stack, Fluentd)
Centralized logging means collecting logs from many services into one place. This makes it easier to analyze and fix problems.
ELK Stack (Elasticsearch, Logstash, Kibana)
- Elasticsearch stores the logs and lets us search through them.
- Logstash processes the logs and sends them to Elasticsearch.
- Kibana lets us view and analyze the logs with a web interface.
Config Example (Logstash to Elasticsearch) −
input {
   file {
      path => "/var/log/*.log"
      start_position => "beginning"
   }
}
filter {
   grok {
      match => { "message" => "%{COMMONAPACHELOG}" }
   }
}
output {
   elasticsearch {
      hosts => ["http://localhost:9200"]
      index => "logs-%{+YYYY.MM.dd}"
   }
}
Fluentd − Fluentd is a tool that can collect, process, and send logs to places like Elasticsearch, Kafka, or cloud storage.
Config Example (Fluentd with Elasticsearch) −
<source>
   @type tail
   path /var/log/*.log
   pos_file /var/log/fluentd.pos
   format none
</source>
<match **>
   @type elasticsearch
   host localhost
   port 9200
   index_name fluentd
</match>
Distributed Tracing for Microservices (e.g., Jaeger, Zipkin)
Distributed tracing helps us track requests as they move through different microservices. It gives us a clear view of where delays or errors happen in the system.
Jaeger − Jaeger is an open-source tool for distributed tracing. It helps us track requests as they go through microservices and find problems.
Example of Jaeger Integration with Spring Boot −
<dependency>
    <groupId>io.jaegertracing</groupId>
    <artifactId>jaeger-client</artifactId>
    <version>1.7.0</version>
</dependency>
Config (application.properties) −
spring.sleuth.sampler.probability=1.0
spring.sleuth.trace-id128=true
spring.zipkin.enabled=true
spring.zipkin.baseUrl=http://localhost:9411/
Zipkin − Zipkin is another tracing tool used in microservices. It collects data about how requests move and helps find issues like delays.
Zipkin Integration (Spring Boot Example) −
<dependency>
    <groupId>org.springframework.cloud</groupId>
    <artifactId>spring-cloud-starter-zipkin</artifactId>
</dependency>
Config (application.properties) −
spring.zipkin.base-url=http://localhost:9411/
spring.sleuth.sampler.probability=1.0
Configuring Log Aggregation and Trace Sampling
Log Aggregation − Centralized systems like ELK or Fluentd gather logs from different sources (servers, apps, containers) and send them to one place.
In microservices, we can add tags to logs, like the service name and trace IDs, to connect events between different services.
Example Log Format (with Trace ID) −
{
   "timestamp": "2024-11-22T14:00:00Z",
   "service": "payment-service",
   "trace_id": "abcd1234",
   "message": "Transaction successful"
}
Trace Sampling − Sampling is important in distributed tracing. It helps us avoid sending too much data, which can slow down the system. We can set a sampling rate to control how much data gets sent.
Example Config (Jaeger Sample Rate) −
sampling:
  rate: 0.1  # Sample 10% of requests
Example Config (Zipkin Sample Rate) −
spring.sleuth.sampler.probability=0.1
Logging and distributed tracing are very important for understanding how systems work and fixing problems in microservices. Centralized logging tools like ELK and Fluentd make it easy to gather logs. Jaeger and Zipkin help us track the flow of requests across services.
Configuring trace sampling and log aggregation helps keep the system fast and makes troubleshooting easier. This lets DevOps teams ensure high reliability and availability in their systems.
Conclusion
In this chapter, we talked about the important parts of Continuous Monitoring in DevOps. We covered key things like monitoring tools, metrics, alerting systems, and the need for centralized logging and distributed tracing.
We looked at solutions like the ELK stack, Fluentd for log aggregation, and Jaeger and Zipkin for tracing requests across services. We also gave examples and showed how to configure these tools. These practices and tools are important for keeping systems reliable, improving performance, and fixing problems quickly.
DevOps - Continuous Improvement
In DevOps, Continuous Improvement helps make development pipelines smoother and reduces problems between steps like code integration, testing, deployment, and monitoring. It uses automation, metrics, and feedback to keep improving the process.
With Continuous Improvement, we can find and fix problems early. This allows teams to adjust quickly to changes in technology and business needs. CI also supports lean methods like Kaizen, where small changes help improve quality and efficiency over time.
Continuous Improvement in DevOps relies on −
- Automated testing to check code quality after each change.
- Automated deployments for fast and easy releases.
- Feedback loops that let teams respond to issues in production quickly, ensuring problems get fixed fast.
Importance of CI in DevOps Culture
Continuous Improvement is very important in DevOps because it encourages teamwork and makes things more efficient. The quick feedback in continuous improvement cycles helps find problems early, which lowers the cost and time to fix them.
CI also fits with DevOps principles, which focus on delivering value quickly and often. This lets teams improve software solutions almost in real-time.
Following are the key reasons why CI is important in DevOps culture:
- Faster Releases − Continuous integration and delivery lead to quicker, smaller releases, reducing time to market.
- Improved Quality − By automating testing and deploying code all the time, we catch and fix errors quickly, which leads to better quality.
- Collaboration − CI strengthens teamwork between development, operations, and QA teams, helping them work together to deliver reliable software.
- Scalability − As teams grow and projects become bigger, CI keeps processes effective and flexible, even with large, distributed teams.
In the end, CI promotes a mindset of constant change, making it an important part of DevOps for encouraging innovation and delivering value in a fast-changing development world.
Key Principles of Continuous Improvement in DevOps
The key principles of Continuous Improvement in DevOps include the following −
- Lean Principles
- Kaizen Methodology
- Feedback Loops and Iterative Processes
Let's understand these three key principles in a little more detail.
Lean Principles
It focuses on getting the most value and reducing waste in DevOps. It applies to both development and operations. It emphasizes on the following aspects −
- Eliminate Waste − Find and remove unnecessary steps or delays, like extra testing or manual handoffs.
- Amplify Learning − Use quick feedback and make small changes to keep improving processes.
- Decide as Late as Possible − Make decisions using the latest and most reliable data to avoid unnecessary work later.
- Deliver as Fast as Possible − Speed up development cycles to quickly release value and get instant feedback.
Kaizen Methodology in DevOps
Kaizen is a method of constant improvement that focuses on small, steady changes. It improves processes, tools, and teamwork over time.
Kaizen methodology emphasizes the following −
- Small, Incremental Improvements − Instead of big changes, make small, regular improvements.
- Employee Involvement − Everyone, from developers to operations teams, helps with improvements.
- Standardization − Follow best practices and set procedures to make sure we get predictable, high-quality results.
- Focus on Root Causes − Solve the main problems that cause inefficiencies, not just the symptoms.
Feedback Loops and Iterative Processes
Continuous feedback and development cycles are key for improving quality and meeting changing business needs. It focuses on the following aspects –
- Real-time Feedback − Ongoing testing, monitoring, and logging give immediate details on how well the application is performing.
- Frequent Releases − Shorter release cycles allow teams to get user feedback faster and fix problems quicker.
- Collaboration and Communication − Regular feedback helps teams stay in sync and make quick changes when needed.
- Adaptability − With iterative development and feedback, teams can stay flexible and change as they get new information.
Measuring and Monitoring Progress in Continuous Improvement
Measuring and monitoring progress in DevOps is very important. It helps us track improvements, find bottlenecks, and make the software delivery pipeline better.
Continuous monitoring lets us check if we are meeting our goals. It also helps to make sure we follow DevOps principles like speed, quality, and teamwork. KPIs and metrics are key in this. They help us measure the impact of changes and guide us to improve more.
Key Performance Indicators (KPIs) for DevOps
KPIs for DevOps focus on how efficient and effective the software delivery pipeline is. These indicators help us understand development speed, stability of operations, and overall performance. Some common KPIs are −
- Deployment Frequency − This measures how often we deploy code to production. A high frequency means we have a strong CI/CD pipeline and work well together.
- Lead Time − This is the time it takes to move code from development to production. A shorter lead time means faster delivery and quicker changes.
- Change Failure Rate − This tracks the percentage of deployments that fail in production. A low failure rate shows that the code quality is good and deployments are stable.
- Mean Time to Recovery (MTTR) − This measures how long it takes to restore service after a failure. A lower MTTR means we recover quickly and manage incidents well.
Metrics to Track Improvement
In DevOps, we track specific metrics to show improvement in software delivery and operational efficiency. These metrics help us find areas that need work and measure progress.
Deployment Frequency − High deployment frequency means we release small updates often. We can track this with CI/CD tools like Jenkins or GitLab CI. These tools help us monitor the number of successful deployments over time.
Take a look at the following example −
# Jenkins Pipeline: track deployment frequency
pipeline {
    agent any
    stages {
        stage('Deploy') {
            steps {
                echo "Deploying to production"
                sh './deploy.sh'
            }
        }
    }
}
Lead Time − This tracks the time from code commit to deployment. Tools like Jira or GitLab can automatically record lead times from commit to release.
Example of a metric query in Jira −
SELECT AVG(time_to_deploy) FROM deploys WHERE status = 'successful';
Change Failure Rate − We can get this metric from logs and monitor it with tools like Prometheus. It tracks app failures after deployment. A high failure rate suggests issues in testing or deployment.
Example Prometheus query −
rate(http_requests_total{status="5xx"}[5m])
MTTR (Mean Time to Recovery) − We track MTTR by measuring how long it takes to fix an incident. Tools like Datadog or Splunk give us real-time data on incident response times, which helps us reduce MTTR.
Tools for Monitoring and Collecting Metrics
To monitor and collect metrics well, DevOps teams use special tools. These tools help us capture, view, and analyze performance data. Some popular tools are:
Prometheus − A powerful open-source monitoring tool. It collects time-series data and queries metrics using PromQL. Prometheus works well with Kubernetes and Docker, making it a great choice for DevOps pipelines.
Example of Prometheus configuration to monitor deployment metrics −
scrape_configs:
  - job_name: 'deployment-metrics'
    static_configs:
      - targets: ['localhost:8080']
Grafana − It helps us visualize data from Prometheus or other sources. Grafana dashboards let us create custom views of KPIs, making it easy to spot trends and bottlenecks.
Example Grafana dashboard configuration for deployment frequency −
{
  "title": "Deployment Frequency",
  "panels": [
    {
      "type": "graph",
      "targets": [
        {
          "expr": "rate(deployment_success_total[1d])",
          "legendFormat": "Deployments"
        }
      ]
    }
  ]
}
Datadog − A cloud-based platform that provides real-time monitoring of metrics, logs, and traces. It integrates with many DevOps tools and gives a complete view of system performance.
Example of Datadog integration with CI/CD pipelines −
- name: Deploy to Production
  action: datadog.monitoring.deploy
  config:
    metric: "deployment.frequency"
    value: 1
    tags: ["env:production"]
Elasticsearch, Logstash, and Kibana (ELK Stack) − This toolchain helps us gather, search, and visualize logs from different services. It is useful for tracking app performance and errors.
Example of configuring Logstash to send deployment logs to Elasticsearch −
input {
   file {
      path => "/var/log/deployments.log"
   }
}
output {
   elasticsearch {
      hosts => ["http://localhost:9200"]
      index => "deployments"
   }
}
By using these tools and tracking the right metrics, DevOps teams can keep measuring progress, find areas to improve, and maintain high performance in software development and delivery.
Automating Feedback Loops for Continuous Improvement
Automating feedback loops helps us make faster changes, find bugs quicker, and keep learning throughout the development process.
- Collecting feedback − We gather feedback from development, testing, and operations using tools like Jira and GitLab Issues. These tools help track bug reports and feature requests.
- Automated Testing − We run tests automatically after every commit to check if the code is good. Tools like Selenium, JUnit, and TestNG help us catch errors early.
- CI/CD Pipelines − CI/CD pipelines automate the flow of code from commit to production. This ensures that we release code often with little human effort.
Continuous Improvement in Infrastructure as Code (IaC)
IaC makes infrastructure management easier by using code. This ensures everything is consistent and automatic.
- Best practices for IaC − We use tools like Terraform, Ansible, and Puppet to create infrastructure in a consistent way.
- Version control − We store IaC configurations in Git repositories. This makes it easy to track changes and roll them back if needed.
- Automating infrastructure changes − We improve continuously by automating infrastructure updates and pushing them through CI/CD pipelines.
Toolchain for Continuous Improvement in DevOps
The right tools help us automate work, collect feedback, and make systems better.
- Essential tools − Tools like Jenkins, GitLab, CircleCI, and SonarQube integrate testing, deployment, and code quality checks into our pipeline.
- Tool integration − We use tools that work well together to automate testing, monitoring, and deployment.
- Choosing tools − We pick tools based on how well they work with our current systems and how scalable they are. This helps us be more efficient.
Continuous Learning and Training
A culture of learning helps us keep up with new technologies and innovate.
- Creating a learning culture − We encourage knowledge sharing and a growth mindset through mentorship and tools like Confluence or Slack.
- Knowledge sharing − We set up systems to share best practices, learnings, and troubleshooting guides so that everyone can access them easily.
- Training and upskilling − We provide ongoing training in new tools and techniques (like Kubernetes or cloud technologies) to make sure the team stays competitive and efficient.
Challenges in Implementing Continuous Improvement
The following table highlights the common challenges in implementing Continuous Improvement and also provides the solutions to overcome them −
| Challenge | Description | Solution |
|---|---|---|
| Identifying bottlenecks | Bottlenecks slow down the pipeline. This causes delays and less output. We need to look closely at the workflow to find them. |
|
| Overcoming resistance to change | Some teams may not like new tools or processes. They may prefer old systems or fear change. |
|
| Scaling CI/CD pipelines in big teams | In big teams or companies, scaling CI/CD pipelines can get complicated. This can lead to slow deployments and limited resources. |
|
Conclusion
In this chapter, we looked at the main ideas and practices of Continuous Improvement in DevOps. We talked about feedback loops, automated testing, and CI/CD pipelines. We also covered monitoring, scaling, and how to handle common problems.
By using these strategies, we can help DevOps teams improve efficiency, quality, and delivery speed. Picking the right tools, building a learning culture, and fixing bottlenecks make the development environment more reliable and scalable.
In the end, following a mindset of continuous improvement helps teams stay competitive and adapt to the fast-changing tech world.
DevOps - Infrastructure
DevOps infrastructure is the base for modern software development and operations. It helps teams to work together, scale up easily, and automate tasks. The main idea is to mix tools, methods, and practices to handle infrastructure in a better way throughout the software process.
When development and operations teams work together, manual work is reduced. It also makes the process faster and more reliable. This way, we can deliver better-quality applications.
What is Infrastructure in DevOps?
In DevOps, infrastructure means the resources we need to create, deploy, and run applications. These resources can be physical, virtual, or cloud-based. They include −
- Servers − Machines (physical or virtual) or containers where applications run.
- Networking − Setups for data transfer, balancing the load, and connecting services.
- Storage − Systems like file storage, databases, and data handling tools.
- Tools and Services − Platforms for automating tasks, monitoring systems, managing CI/CD pipelines, and setting configurations.
DevOps looks at infrastructure as code. This means we can manage it just like we manage application code using Infrastructure as Code (IaC). IaC makes sure everything is consistent and easy to repeat or scale.
Key Principles of DevOps Infrastructure
The following table highlights the key principles of DevOps infrastructure −
| Principle | Description |
|---|---|
| Automation | We automate tasks like setting up, configuring, and scaling resources. This saves time and reduces mistakes. Tools like Terraform or Ansible help us create the same setups every time. |
| Scalability and Elasticity | We design systems that handle changes in workload automatically. Using cloud platforms, we can easily add or remove resources based on needs. |
| Immutability | Instead of changing existing infrastructure, we replace parts like containers during updates. This keeps things consistent and predictable. |
| Version Control | We track infrastructure changes with tools like Git. This makes it easier to manage and roll back changes when needed. |
| Monitoring and Observability | Tools like Prometheus and Grafana help us keep an eye on the system's health and performance all the time. |
| Security by Design | Security is built into our workflows from the start. We use things like secrets management and automated compliance checks to keep the system safe. |
Infrastructure as Code (IaC): End-to-End Example
Infrastructure as Code (IaC) helps us manage and set up infrastructure using code. It replaces manual work with automation. This makes things consistent, easy to scale, and repeatable. Tools like Terraform, AWS CloudFormation, or Ansible are commonly used for IaC.
IaC works well with DevOps pipelines. It supports continuous delivery and lets us track changes in the infrastructure like we do with code.
Step-by-Step Example: Provisioning a Web Server with Terraform
Prerequisites
First of all, install Terraform on your machine. Next, set up an AWS account and configure aws-cli with credentials.
Directory Structure
Arrange project files like this −
/iac-example
   main.tf
   variables.tf
   outputs.tf
Define Variables (variables.tf)
This file helps us make the setup flexible −
variable "region" {
   description = "AWS region"
   default     = "us-east-1"
}
variable "instance_type" {
   description = "EC2 instance type"
   default     = "t2.micro"
}
Configure Resources (main.tf)
We define the infrastructure here −
provider "aws" {
   region = var.region
}
resource "aws_instance" "web" {
   ami           = "ami-0c02fb55956c7d316" # Amazon Linux 2 AMI
   instance_type = var.instance_type
   tags = {
      Name = "TerraformExampleWebServer"
   }
   provisioner "remote-exec" {
      inline = [
         "sudo yum update -y",
         "sudo yum install -y httpd",
         "sudo systemctl start httpd",
         "sudo systemctl enable httpd"
      ]
   }
}
resource "aws_security_group" "web_sg" {
   name_prefix = "web-sg-"
   ingress {
      from_port   = 80
      to_port     = 80
      protocol    = "tcp"
      cidr_blocks = ["0.0.0.0/0"]
   }
   egress {
      from_port   = 0
      to_port     = 0
      protocol    = "-1"
      cidr_blocks = ["0.0.0.0/0"]
   }
}
Output Information (outputs.tf)
Show important details after the setup −
output "instance_public_ip" {
   value = aws_instance.web.public_ip
}
Execute the Terraform Workflow
Run these commands to create the infrastructure −
terraform init        # Initialize the Terraform environment
terraform plan        # See the execution plan
terraform apply       # Apply the changes
Verify the Setup
After running terraform apply, Terraform will give you the EC2 instance's public IP. Open the IP in a browser to check if the web server is working.
This example shows how to set up a simple web server on AWS using Terraform. IaC simplifies modern infrastructure management. It helps us work faster and better with DevOps practices.
Cloud Infrastructure
Cloud infrastructure is the combination of hardware and software needed to provide computing resources like storage, networking, and computing power over the Internet.
Cloud service providers like AWS, Microsoft Azure, and Google Cloud Platform (GCP) manage this infrastructure. With cloud infrastructure, we can access resources anytime without needing physical hardware. It's scalable, flexible, and works on demand.
Public vs. Private vs. Hybrid Clouds
Public Cloud − A public cloud is managed by third-party companies like AWS, Azure, or GCP. They provide resources over the Internet. In a public cloud, many organizations use the same infrastructure. This makes it cheap, scalable, and easy to use with a pay-as-you-go model. Examples include Amazon EC2 and Microsoft Azure Virtual Machines.
Private Cloud − A private cloud is dedicated to just one organization. It can be hosted either on-premises or by a third-party provider. This type of cloud offers better security, more control, and customization compared to public clouds. However, it can be more expensive. Private clouds are great for industries that need high data privacy.
Hybrid Cloud − A hybrid cloud combines public and private clouds. This allows data and applications to move between both. The hybrid model is flexible. It lets businesses use the public cloud’s scalability while keeping sensitive data in the private cloud. This helps with managing workloads, security, and compliance
Using AWS / GCP / Azure for Infrastructure Management
Each of the following cloud platform has its own strengths. The best choice depends on what we need, our current setup, and business requirements.
AWS (Amazon Web Services)
AWS has many services, like compute (EC2), storage (S3), and databases (RDS, DynamoDB). It also offers tools like CloudFormation and AWS OpsWorks to automate things. AWS has managed services such as AWS Elastic Beanstalk for web apps and AWS Lambda for serverless computing.
GCP (Google Cloud Platform)
GCP is good for machine learning, analytics, and AI. Key tools are Google Compute Engine for virtual machines, Google Kubernetes Engine (GKE) for containers, and Google Cloud Storage. GCP is especially useful for data analytics with tools like BigQuery.
Microsoft Azure
Azure is the cloud platform by Microsoft. It offers compute (Azure Virtual Machines), storage (Azure Blob Storage), and networking (Azure Virtual Network). Azure works well with Microsoft software. It also supports hybrid cloud setups with Azure Arc. Many businesses using Microsoft tools prefer Azure.
Advanced Concepts of Cloud Infrastructure
The following table highlights some advanced concepts of Cloud Infrastructure −
| Concept | Key Points | Explanation |
|---|---|---|
| CI/CD Pipeline Infrastructure | Building CI/CD Pipelines with Jenkins, GitLab CI, or ArgoCD | Jenkins helps automate builds and deployment with plugins. GitLab CI connects version control and CI/CD. ArgoCD is used for Kubernetes-native continuous deployment using GitOps. |
| Automating Infrastructure Deployment in Pipelines | With IaC tools like Terraform and CloudFormation, we can automatically deploy infrastructure, ensuring its consistent and repeatable in CI/CD pipelines. | |
| Networking in DevOps Infrastructure | Managing Virtual Networks and Subnets | Virtual networks (VNets) create isolated cloud environments. Subnets split these networks into smaller parts to manage traffic and improve security. |
| Load Balancers and Traffic Routing | Load balancers share traffic across servers, ensuring availability. Routing helps improve app performance by directing traffic in a smart way. | |
| Implementing Service Mesh (Istio, Linkerd) | Service meshes like Istio and Linkerd manage communication between microservices, offering traffic management, security, and observability without changing app code. | |
| Security in Infrastructure | Securing Infrastructure as Code | We validate IaC scripts with tools like Checkov or Sentinel. This helps enforce security rules and avoids mistakes before deployment. |
| Using Vault for Secrets Management | Vault securely stores sensitive data, like API keys and passwords. It encrypts and dynamically manages secrets, fitting into CI/CD workflows for safe credential management. | |
| DevSecOps: Integrating Security into Pipelines | We add security practices early in the CI/CD pipeline with tools like Snyk and Aqua Security. These scan code for vulnerabilities during build or deployment. | |
| Scaling Infrastructure | Horizontal vs. Vertical Scaling | Horizontal scaling adds more instances to share the load. Vertical scaling adds more resources (CPU/RAM) to existing machines. Horizontal scaling gives better flexibility and redundancy. |
| Auto-Scaling Infrastructure with Kubernetes and Cloud Tools | Kubernetes and cloud services (AWS, GCP, Azure) automatically scale resources based on demand, helping with performance and resource use. | |
| Cost Optimization While Scaling | To optimize costs, we can choose the right-sized instances, use spot instances, and enable auto-scaling. This helps balance cost and performance. | |
| Disaster Recovery and Backup | Backup Solutions for DevOps Infrastructure | Backup tools like AWS Backup and Azure Backup save data and configurations. These backups ensure we can recover data during failures. |
| Automating Recovery in Failover Scenarios | Tools like Route 53 and Cloud DNS help with auto-recovery during failures. They minimize downtime, making sure the system keeps running smoothly. | |
| Infrastructure Testing and Validation | Unit Testing IaC Scripts | Unit tests help verify the correctness of IaC scripts before deployment. Tools like Terraform check and plan scripts to make sure they work as expected. |
| Using Tools like Test Kitchen and Terratest | Test Kitchen and Terratest automate the testing of IaC by deploying infrastructure, running tests, and checking if it works correctly. | |
| Chaos Engineering to Test Resilience | Chaos Engineering introduces controlled failures using tools like Chaos Monkey to check how resilient the infrastructure is and ensure it recovers from disruptions. |
Conclusion
In this chapter, we looked at the key parts of modern infrastructure management. We covered setting up CI/CD pipelines, networking, security, scaling, disaster recovery, and infrastructure testing. Tools like Jenkins, GitLab CI, and ArgoCD help us automate pipelines easily. We also talked about how load balancing, service meshes, and cloud scaling improve performance and keep things available.
We also discussed securing infrastructure with practices like DevSecOps and Vault. To make sure everything stays resilient, we talked about using chaos engineering and automated recovery. By understanding and using these ideas, we can build strong, scalable, and secure infrastructures that support continuous delivery, security, and smooth operations.
DevOps - Git
Git is a distributed version control system. It plays a big role in DevOps workflows. We use Git to manage source code, help developers collaborate, and automate continuous integration/continuous deployment (CI/CD) pipelines. Git makes it easy to track versions, create branches, and merge code changes.
These features are very important for fast collaboration and quick development cycles. Git repositories are the core of DevOps pipelines. They trigger automated builds, tests, and deployments. This ensures we deliver software quickly, consistently, and with full traceability.
Setting Up Git for DevOps Workflow
In this section, let's understand how to set up Git for DevOps workflow.
Installing and Configuring Git
To start with Git in a DevOps workflow, first, we need to install it on our system −
Linux
sudo apt-get install git
macOS
brew install git
Windows
We can download and install Git from the official website.
After installing Git, we need to set up our user details globally −
git config --global user.name "Your Name"
git config --global user.email "you@example.com"
This makes sure that our commits are correctly linked to us. To check the setup, we can use −
git config --list
Integrating Git with CI / CD Tools (Jenkins, GitLab CI, etc.)
Git works well with CI/CD tools like Jenkins, GitLab CI, and others. It helps trigger builds and deployments automatically.
Jenkins
First, we need to install the Git Plugin in Jenkins. In the Jenkins job setup, we add the Git repository URL and our credentials. We configure the build to start based on Git events, like a push or pull request. Take a look at the following example −
scm:
  git:
    - url: 'https://github.com/your-repository.git'
      branch: 'main'
GitLab CI
We define our CI/CD pipeline in a file called .gitlab-ci.yml inside the repository. Take a look at the following example −
stages:
  - build
  - test
  - deploy
build:
  stage: build
  script:
    - npm install
test:
  stage: test
  script:
    - npm test
deploy:
  stage: deploy
  script:
    - ./deploy.sh
This makes sure that each push to the Git repository will trigger the correct CI/CD pipeline.
Branching Strategies in DevOps
In DevOps, branching strategies help us manage how we make changes to our code in a Git repository. A good branching strategy is very important for better teamwork, faster development, and smooth CI/CD pipelines. Some common strategies we use are Git Flow, GitHub Flow, and trunk-based development.
Git Flow vs. GitHub Flow vs. Trunk-Based Development
Git Flow − Git Flow is an old method. In this strategy, the master branch has the stable code for production, and the develop branch has the latest development changes. New features go into separate feature branches. We create releases from the release branch, and any urgent fixes are done in the hotfix branch. This method works well for big projects that need planned releases.
git flow init
GitHub Flow − GitHub Flow is simpler and works best for continuous delivery. In this method, we create feature branches from main, work on them, and once ready, merge them back into main. This is good for teams that deploy often and use pull requests to review code.
git checkout -b feature-branch
git push origin feature-branch
Trunk-Based Development − Trunk-based development focuses on making small, frequent commits directly to the main (or trunk) branch. We often create short-lived feature branches or sometimes work directly on main and merge changes multiple times a day. This method supports continuous integration and delivery with minimal branching.
git checkout main
git pull origin main
git merge feature-branch
Creating and Managing Feature, Release, and Hotfix Branches
In DevOps, we create and manage different branches for features, releases, and hotfixes. This helps us work on different tasks without disturbing the main code.
Feature Branches − We use feature branches to develop new features or improvements without changing the main code. These branches are created from the main or develop branch.
git checkout -b feature/login-ui
Release Branches − Release branches help us prepare the code for deployment. We use them for last-minute changes, bug fixes, and versioning before merging back into main and develop.
git checkout -b release/1.0.0
Hotfix Branches − Hotfix branches are made for quick fixes in the production environment. After fixing the issue, we merge the hotfix back into both main and develop to keep them up-to-date.
git checkout -b hotfix/fix-crash
Merging and Rebasing Strategies in Team Collaboration
We can use either merging or rebasing to bring changes from different branches together.
Merging − Merging combines changes from one branch into another while keeping the commit history. This is helpful when we want to maintain the full context of each change.
git merge feature-branch
Rebasing − Rebasing moves the entire branch to start from the latest commit of the target branch, which gives a cleaner history. Its helpful when we want to avoid extra merge commits.
git rebase main
When to Use Merging or Rebasing
- We prefer merging when we want to keep the exact history of our changes.
- We use rebasing when we want a clean history, especially for feature branches before merging them into main.
The strategy we choose depends on our team's workflow, release schedule, and whether we want a detailed or clean commit history.
Git Hooks in DevOps Automation
Git hooks are simple scripts that run at different points during the Git process. They help automate tasks before or after certain Git actions. Using hooks can make our workflow smoother and help enforce good practices in DevOps pipelines.
- pre-commit − This hook runs before a commit is created. It's useful for checking code style or running linters to keep the code clean.
- commit-msg − It runs after the commit message is written but before the commit is finished. It ensures that commit messages follow a certain style.
- post-commit − This one runs after a commit. It's often used to notify teams or run extra tests.
- pre-push − This hook runs before changes are pushed to a remote repository. It can be used to run unit tests or validation checks before pushing.
- post-merge − This runs after a merge. It can trigger deployment scripts or run extra tests after merging code.
We usually place these hooks in the .git/hooks/ folder. We can also customize them based on our DevOps pipeline needs.
Automating Linting, Testing, and Deployment with Git Hooks
Git hooks are great for automating tasks like linting, testing, and deployment during development. For example:
pre-commit (Linting)
We can automatically lint code before each commit to make sure the code is clean.
Example for a pre-commit hook (using eslint for JavaScript) −
# .git/hooks/pre-commit
#!/bin/sh
npm run lint
if [ $? -ne 0 ]; then
  echo "Linting failed, commit aborted!"
  exit 1
fi
pre-push (Testing)
We can run unit tests before pushing to make sure the code doesn't break anything.
Example for a pre-push hook (using jest for testing) −
# .git/hooks/pre-push
#!/bin/sh
npm test
if [ $? -ne 0 ]; then
   echo "Tests failed, push aborted!"
   exit 1
fi
post-commit (Deployment)
After committing, we can trigger deployment scripts, especially for staging or production environments.
Example for a post-commit hook (deploying to a server) −
# .git/hooks/post-commit
#!/bin/sh
./deploy.sh
These hooks help automate tasks like checking code, running tests, and deploying, all while staying tightly integrated with the Git workflow.
Conclusion
In this chapter, we explained the key aspects of using Git in a DevOps environment. We covered setting up Git for workflows, automating common Git operations, managing branches, using Git hooks, and automating deployment scripts.
By using Git's power in DevOps pipelines, we can ensure consistent code quality. It also helps us streamline testing and deployment and improve collaboration.
DevOps - Docker
We see that DevOps and Docker are very important in today's software development and deployment. They help to make processes easier and improve teamwork. In this chapter, we will look at the basic ideas of Docker. We will also check its architecture and how it works in the DevOps lifecycle.
First, we will learn how to set up Docker in a DevOps environment. Then, we will manage images and containers. After that, we will look at networking settings. Finally, we will see how to connect Docker with CI/CD pipelines. This will help us deliver software more efficiently.
Understanding the Docker Architecture
In Docker architecture, we have many important parts that work together to help us use containerization.
The key components of the Docker architecture are listed below −
- Docker Daemon (dockerd) − This is the main service that takes care of Docker containers, images, networks, and volumes. It listens for API requests and manages container tasks.
- Docker Client (docker) − This is the command-line tool that we use to talk to the Docker daemon. We run commands like docker run, docker build, and docker ps
- Docker Images − These are read-only templates that we use to create containers. We build them from a Dockerfile. The Dockerfile tells us how to make the image.
- Docker Containers − These are running versions of Docker images. They let us run applications in separate spaces.We create them from images using the command docker run.
- Docker Registry − This is a place to store and share Docker images, like Docker Hub. It lets us push and pull images.
Setting Up Docker in a DevOps Environment
To use Docker well in our DevOps work, we can follow these easy steps for installation and setup.
Step 1. Install Docker
For Ubuntu: Use the following commands to install Docker on Ubuntu −
sudo apt update
sudo apt install apt-transport-https ca-certificates curl software-properties-common
curl -fsSL https://download.docker.com/linux/ubuntu/gpg | sudo apt-key add -
sudo add-apt-repository "deb [arch=amd64] https://download.docker.com/linux/ubuntu $(lsb_release -cs) stable"
sudo apt update
sudo apt install docker-ce
For Windows / Mac − We can download the Docker Desktop app from the official website.
Step 2. Start Docker Service
We need to start the Docker service with these commands −
sudo systemctl start docker
sudo systemctl enable docker
Step 3. Add User to Docker Group
To not use sudo for Docker commands, we can add our user to the Docker group −
sudo usermod -aG docker $USER
Dont forget to log out and then log back in to make the changes work.
Step 4. Verify Installation
We can check if Docker is working fine with these commands −
docker --version
docker run hello-world
Step 5. Configure Docker Daemon
We can edit the /etc/docker/daemon.json file for some custom settings −
{
  "storage-driver": "overlay2",
  "log-level": "error"
}
After that, we need to restart the Docker service −
sudo systemctl restart docker
Now that we have Docker ready, we can start to containerize our applications and add them to our CI/CD pipeline.
Docker Images and Containers: Best Practices
We can use Docker images and containers well in a DevOps environment if we follow some best practices.
Docker Images
Minimize Image Size − We should use small base images like alpine. This helps to make our images smaller and faster to download.
Layer Management − We can combine commands in one RUN statement. This will help us reduce the number of layers. For example −
RUN apt-get update && apt-get install -y \
    package1 \
    package2 \
    && rm -rf /var/lib/apt/lists/*
Use .dockerignore − Just like .gitignore, we can list files to leave out from the build context. This will also help to make our image size smaller.
Tagging − Let's use semantic versioning for our tags. For example, we can use myapp:1.0.0. We should be careful with using latest.
Docker Containers
Resource Limits − We need to set limits on CPU and memory. This helps to stop our containers from using too many resources −
docker run --memory="256m" --cpus="1.0" myapp
Environment Variables − We can use environment variables for configuration. This way, we do not hardcode sensitive information in our code.
Regular Updates − We should keep our images updated. This helps to fix vulnerabilities. We need to scan our images for security problems regularly.
By following these practices, we can improve the performance, security and maintenance of our Docker images and containers.
Docker Networking: Concepts and Configuration
We can use Docker networking to let our containers talk to each other and to outside systems. It is important to know the different networking modes for managing our containers well. Docker gives us several networking options −
Bridge Network
This is the default network for our containers. It lets containers communicate with each other on the same host
docker network create my_bridge_network
docker run -d --name container1 --network my_bridge_network nginx
docker run -d --name container2 --network my_bridge_network nginx
Host Network
The Host Network skips the Docker networking stack. It connects the container directly to the host network.
docker run --network host nginx
Overlay Network
The Overlay Network allows containers on different Docker hosts to communicate. It is useful when we use Swarm mode.
docker network create -d overlay my_overlay_network
Macvlan Network
This lets our containers have their own MAC addresses. They look like real devices on the network.
docker network create -d macvlan \
  --subnet=192.168.1.0/24 \
  --gateway=192.168.1.1 \
  -o parent=eth0 my_macvlan_network
When we understand these ideas and setups, we can manage our Docker containers better in a DevOps environment.
Managing Docker Containers with Docker Compose
We use Docker Compose to help manage multi-container Docker applications. It makes it easy to define and run these applications with just one YAML file. This way, orchestration becomes simpler.
Key Features
- Service Definition − We define services, networks, and volumes in a docker-compose.yml file.
- Environment Configuration − We can easily manage environment variables for our containers.
- Scaling − We can scale services up or down with a simple command.
Basic Structure of docker-compose.yml −
version: '3.8'
services:
  web:
    image: nginx:latest
    ports:
      - "8080:80"
  db:
    image: mysql:5.7
    environment:
      MYSQL_ROOT_PASSWORD: example
Common Commands
Start Services −
docker-compose up
Stop Services −
docker-compose down
Scale Services −
docker-compose up --scale web=3
Using Docker Compose helps us streamline the development and deployment of applications. It makes managing dependencies and configurations for multi-container setups easier.
CI / CD Integration with Docker
We can make our development better by adding Docker to our Continuous Integration and Continuous Deployment (CI/CD) pipelines. Docker helps us create consistent builds and make deploying applications easier.
Following are the key components −
Dockerfile − This file tells us how to build Docker images.
FROM node:14

WORKDIR /app

COPY package*.json ./

RUN npm install

COPY . .

CMD ["npm", "start"]
CI / CD Tools − We can use popular tools like Jenkins, GitLab CI, CircleCI, and GitHub Actions with Docker.
Pipeline Example
Build − We create a Docker image from the Dockerfile.
docker build -t myapp:latest
Test − We run tests inside a container.
docker run --rm myapp:latest npm test
Deploy − We push the image to a registry and deploy it to production.
docker push myapp:latest
Conclusion
In this chapter, we looked at the basics of Docker in a DevOps framework. We talked about its structure and how to set it up. We also shared best ways to use images and containers.
Networking setup was another topic we covered. Lastly, we talked about managing Docker with Docker Compose. We also showed how to add Docker into CI/CD pipelines.
DevOps - Selenium
In this chapter, we will look at how DevOps and Selenium work together and how they can help software testing.
We will talk about key ideas. First, we will see why DevOps is important in testing. Then, we will look at how Selenium fits into automation frameworks. Finally, we will share some best practices for using these tools in a continuous integration and delivery environment.
Overview of Selenium and Its Role in Automation
We know that Selenium is a strong open-source tool. It helps us automate web applications on different browsers and platforms. It works with many programming languages like Java, C#, Python, and Ruby. This makes it useful for both developers and testers.
Key Components of Selenium
- Selenium WebDriver − This gives us a way to create and run test scripts. It talks directly to the browser. This gives us more control and makes it flexible.
- Selenium Grid − This helps us run tests at the same time on different environments. This makes our testing faster.
- Selenium IDE − This is a tool that lets us record and play back tests quickly. It is good for beginners.
Role in Automation:
- Cross-Browser Testing − This checks if our applications work well on different browsers like Chrome, Firefox, and Safari.
- Continuous Testing − We can use it with CI/CD pipelines. This helps us automate regression tests and get quick feedback.
- Test Coverage − It supports many types of tests. This includes functional tests, regression tests, and performance tests.
Example of a Simple Selenium Test in Python
from selenium import webdriver

# Initialize WebDriver
driver = webdriver.Chrome()

# Open a webpage
driver.get("https://example.com")

# Find an element and perform an action
driver.find_element_by_name("q").send_keys("Selenium")

# Close the browser
driver.quit()
Integrating Selenium with CI/CD Pipelines
We can make our software testing better by using Selenium in Continuous Integration and Continuous Deployment (CI/CD) pipelines. This helps us run tests automatically. It also makes sure that our application stays good in quality while we develop it.
Steps to Integrate Selenium with CI/CD
Version Control System (VCS) Integration − We can use tools like Git to handle our code. We should run tests when we commit code.
Continuous Integration Tools − We can use tools like Jenkins, CircleCI, and GitLab CI to automate building and testing.
Here is an example of Jenkins Pipeline setup −
pipeline {
   agent any
   stages {
      stage('Build') {
         steps {
            sh 'mvn clean package'
         }
      }
      stage('Test') {
         steps {
            sh 'mvn test'
         }
      }
   }
}
Test Environment Setup − We can use Docker to make separate spaces for our Selenium tests. We need to set up Selenium WebDriver to work with our application.
Triggering Tests Automatically − We should set up webhooks or polling. This will help us run Selenium tests when we deploy or change code.
Reporting − We can add reporting tools like Allure or ExtentReports. They will help us see the results of our tests.
By doing these steps, we can make sure our Selenium tests fit well into our CI/CD pipelines. This will help us deliver software faster and more reliably.
Containerization of Selenium Tests with Docker
We know that containerization helps us have the same testing environments every time. This is very important in a DevOps pipeline. Docker makes it easy to set up and run Selenium tests. It does this by putting the tests and what they need into containers. This way, we can avoid problems that come from different setups in development and testing.
Key Steps to Containerize Selenium Tests
Create a Dockerfile − We need to define the environment for our Selenium tests.
FROM selenium/standalone-chrome:latest

WORKDIR /app
COPY . /app

RUN apt-get update && apt-get install -y \
    curl \
    && rm -rf /var/lib/apt/lists/*

CMD ["python", "test_script.py"]
Build the Docker Image −
docker build -t selenium-test .
Run the Container −
docker run --rm -v $(pwd):/app selenium-test
Benefits of Dockerizing Selenium Tests
Following are the benefits of dockerizing Selenium tests −
- Isolation − Each test suite runs in its own space.
- Scalability − We can easily run many tests at the same time.
- Version Control − We can manage different versions of our testing setup.
By using Docker, we can get feedback faster and work better together in development and testing.
Implementing Selenium Grid for Parallel Testing
We can use Selenium Grid to run tests on many browsers and environments at the same time. This helps us save time on test runs. It also makes our testing process better in a DevOps pipeline.
Key Components of Selenium Grid
- Hub − This is the main point that controls test runs. It sends tests to the nodes that are registered.
- Node − This is a machine that runs tests on a specific browser version and platform.
Setting Up Selenium Grid
Start the Hub − We need to run this command to start the Hub −
java -jar selenium-server-standalone.jar -role hub
Start a Node − Next step is to register a Node with the Hub −
java -Dwebdriver.chrome.driver=path/to/chromedriver
   -jar selenium-server-standalone.jar -role node
   -hub http://localhost:4444/grid/register
Example Test Configuration
DesiredCapabilities capabilities = DesiredCapabilities.chrome();
WebDriver driver = new RemoteWebDriver
   (new URL("http://localhost:4444/wd/hub"), capabilities);
By using Selenium Grid, we improve our testing efficiency. This helps us fit better into our CI/CD workflows. ## Monitoring and Reporting Test Results in DevOps
We know that monitoring and reporting test results are very important in a DevOps environment. This helps us keep quality high and improve continuously. Let’s look at some key points we should think about.
Key Components
Real-time Monitoring − We can use tools like Prometheus or Grafana to see test execution and system performance in real-time.
Centralized Reporting − Tools like Allure or TestNG can help us create reports that gather results from many test runs.
Reporting Practices
Automated Reporting − We should link our test frameworks with CI/CD tools like Jenkins or GitLab CI to make reports automatically after each build.
Dashboard Visualization − Let's create dashboards that show visual results of tests, trends over time, and important metrics.
Example Integration with Jenkins
pipeline {
    agent any
    stages {
        stage('Test') {
            steps {
                script {
                    sh 'mvn clean test'
                    junit 'target/surefire-reports/*.xml'
                }
            }
        }
        stage('Report') {
            steps {
                // Generate Allure report
                allure includeProperties: false, jdk: '', results: [[path: 'allure-results']]
            }
        }
    }
}
Metrics to Monitor
- Pass/Fail Rates − We need to track how many tests pass and how many fail.
- Execution Time − We should measure how long it takes for test suites to run.
- Failure Trends − It is important to find patterns in test failures so we can fix repeated issues.
By using these practices, we can improve how we see the testing process. This helps us respond to issues early and keep software quality high.
Conclusion
In this chapter, we looked at how DevOps and Selenium work together. We saw why continuous testing is very important in software development. We talked about what Selenium does for automation. We also discussed how it fits with CI/CD pipelines.
We shared best practices and talked about the good things that come from using containerization and parallel testing with Selenium Grid. By using these strategies, we can improve software quality. We can also speed up delivery times and create a better teamwork culture in our DevOps processes.
DevOps - Jenkins
In this chapter, we will look at Jenkins, which is an open-source automation server. It plays an important role in making continuous integration and delivery easier.
We will talk about Jenkins architecture. We will also discuss how to set it up, configure jobs, and connect it with version control systems. Finally, we will explain how to use pipelines as code. This will give us a complete guide to using Jenkins in our DevOps practices.
Understanding Jenkins Architecture
Jenkins is a strong automation server that helps us with continuous integration and continuous delivery, we call it CI/CD. Its design is based on a master-agent model. This model helps us to be more scalable and reliable.
- Jenkins Master − This is the main control unit that runs the build process. It schedules jobs, sends builds to agents, and checks their progress. It gives us the web interface for setting things up and monitoring.
- Jenkins Agents (Slaves) − These are separate machines that carry out jobs from the master. They can work on different systems like Windows or Linux. They allow us to run builds in a distributed way to make things faster.
- Job Configuration − We define jobs as a series of steps that Jenkins will run. We can set them up using the user interface or with configuration files.
- Plugins − Jenkins has a flexible design. This means we can add many plugins. These plugins help us with notifications, version control, build tools, and more.
This design lets us use Jenkins to manage complicated CI/CD tasks across different environments.
Setting up Jenkins Environment
We can set up a Jenkins environment by following these easy steps.
Following are the prerequisites −
- Java − We need to make sure that Java Development Kit (JDK) is installed. It should be Java 8 or higher.
- Operating System − It can run on Windows, macOS, or Linux.
Installation Steps
Download Jenkins − We go to the Jenkins download page and pick the right package for our system.
Install Jenkins − For Windows, run the installer and just follow the setup wizard. For Linux, use package managers like this −
sudo apt update
sudo apt install jenkins
For macOS − We can use Homebrew like this −
brew install jenkins-lts
Start Jenkins − On Linux, we run this command −
sudo systemctl start jenkins
On Windows, we look for Jenkins in the services and start it from there.
Access Jenkins
We open a browser and go to http://localhost:8080. We need to unlock Jenkins with the initial admin password. We can find it by running this command −
cat /var/lib/jenkins/secrets/initialAdminPassword
Configure Jenkins
Follow the setup wizard. It helps us to install suggested plugins and make an admin user.
Creating and Configuring Jenkins Jobs
Creating and configuring jobs in Jenkins is very important for automating builds and deployments. Jenkins can handle different types of jobs. These include Freestyle projects, Pipeline projects, and Multibranch Pipelines.
Steps to Create a Jenkins Job
Access Jenkins Dashboard − Open Jenkins in a web browser.
Create a New Job − Click on "New Item" on the dashboard. Enter a name for our job.
We select the job type like Freestyle project or Pipeline and then click "OK."
Configure Job Settings −
- General − We add a description. We can also choose to discard old builds.
- Source Code Management − We set up our version control system like Git.
Repository URL: https://github.com/user/repo.git
Credentials: [Add credentials if needed]
- Build Triggers − We set triggers such as "Build periodically" or "Poll SCM".
- Build Environment − We configure any needed environment settings.
- Build Steps − We define the steps to run. For example, we can invoke a shell script.
# Example shell command
echo "Building the project..."
Post-build Actions − We specify what to do after the build. This could be sending notifications or archiving artifacts.
Save and Build: We click "Save" to keep our settings. We can start a build by clicking "Build Now" from the job page.
With these settings, we can make Jenkins jobs that automate our processes very well.
Integrating Jenkins with Version Control Systems
We need to integrate Jenkins with version control systems (VCS) to automate the build process. Jenkins works with many VCS like Git, Subversion (SVN), and Mercurial.
Steps to Integrate Jenkins with Git
Install Git Plugin − Go to Manage Jenkins and then to Manage Plugins. Install the "Git Plugin".
Configure Jenkins Global Settings − Click on Manage Jenkins and then Global Tool Configuration. Set up the path for Git installation.
Create a New Jenkins Job − We click on New Item, choose Freestyle project, and give it a name.
Configure Source Code Management − In the job settings, we select Git. We enter the repository URL like https://github.com/user/repo.git. If the repository is private, we add the credentials.
Set Build Triggers − We enable Poll SCM to check for changes at certain times, for example H/5 * * * *.
Example Configuration
# Jenkins Job Configuration
scm:
  git:
    branches:
      - master
    remote:
      url: https://github.com/user/repo.git
By following these steps, Jenkins will pull the latest code changes from the VCS we specified. This helps us with Continuous Integration.
Implementing Continuous Integration with Jenkins
Continuous Integration (CI) is a way we develop software. In this method, we automatically build, test, and deploy our code changes. This helps us keep quality and integration. Jenkins helps us with CI by automating these steps.
Steps to Implement CI with Jenkins
Create a Jenkins Job − We can choose Freestyle or Pipeline job types. We need to set up the source code repository. For example, we can use Git.
Configure Build Triggers − We set triggers to check the SCM or use webhooks. This helps to build automatically.
triggers {
    scm('H/5 * * * *') // This checks SCM every 5 minutes
}
Define Build Steps − We specify the build tools. This could be Maven, Gradle, or scripts.
steps {
    sh 'mvn clean package' // This is for Maven projects
}
Add Post-Build Actions − We can set up notifications, save artifacts, or deploy builds.
post {
    success {
        archiveArtifacts artifacts: '**/target/*.jar', fingerprint: true
    }
}
Test Automation − We can add testing frameworks like JUnit or Selenium. They run tests after builds automatically.
Monitor Builds − We can use Jenkins dashboards. This helps us to watch build statuses and logs.
By following these steps, we can easily implement Continuous Integration in our development work with Jenkins.
Example of a Declarative Pipeline
pipeline {
    agent any
    stages {
        stage('Build') {
            steps {
                echo 'Building...'
                sh 'make'
            }
        }
        stage('Test') {
            steps {
                echo 'Testing...'
                sh 'make test'
            }
        }
        stage('Deploy') {
            steps {
                echo 'Deploying...'
                sh 'make deploy'
            }
        }
    }
}
By using Pipelines as Code, we can make our DevOps work better and improve how we deploy.
Conclusion
In this chapter, we looked at the basics of Jenkins. We talked about its design, how to set it up, how to configure jobs, and how to connect it with version control systems. We also discussed how to use continuous integration and Jenkins Pipeline as Code.
DevOps - Puppet
Puppet helps us manage our infrastructure as code. This means we can automate things like configuration management and deployment.
In this chapter, we will look at Puppet's architecture. We will go through the steps for installing it. We will also learn how to write good manifests. We will talk about managing modules, classifying nodes, and how to connect Puppet with CI/CD pipelines.
Understanding Puppet Architecture
We can think of Puppet architecture as a way to manage configuration and automate tasks across many systems. It has some key parts −
- Puppet Master − This is the main server. It controls the configuration data and sends it to the nodes we manage. It puts together manifests and makes catalogs for each node.
- Puppet Agent − We install these agents on the nodes we manage. They ask the Puppet Master for updates, apply the configurations, and then tell back their status.
- PuppetDB − This is an optional database. It keeps data that Puppet creates, like facts and reports. It helps us find data faster and improves performance.
- Facts − These are pieces of information about the system. Puppet agents collect these from their nodes. Facts include things like the OS version, IP address, and installed packages. We use facts to make decisions about configurations.
- Manifests − We write these in Puppet’s special language called DSL. Manifests show how we want the nodes to be set up. We keep them in modules.
- Modules − These are groups of manifests, files, and templates. They hold specific configurations or applications.
Puppet Architecture Flow
The Puppet agent talks to the Puppet Master using HTTPS. The Puppet Master makes a catalog from the manifests and facts that the agent gives. The agent uses the catalog to make sure the node’s setup is how we want it.
This architecture helps us manage our infrastructure in a flexible and scalable way. It makes Puppet a strong tool in DevOps practices.
Installing Puppet
To install Puppet, we need to follow the steps for our operating system. Puppet works on many platforms like Linux, macOS, and Windows. Here are the simple steps for installing it on a Linux system −
Prerequisites − We need root or sudo access. Let's update our package manager.
Installation Steps
For Debian/Ubuntu
sudo apt-get update
sudo apt-get install -y puppet
For Red Hat/CentOS
sudo yum install -y epel-release
sudo yum install -y puppet
For Windows
We need to download the Puppet installer from the Puppet downloads page. Then, we run the installer and follow the steps shown.
Verifying the Installation
After we install, we should check if Puppet is installed right. We can do this by checking the version −
puppet --version
Puppet Configuration
Puppet's main configuration file is at /etc/puppet/puppet.conf. We can edit this file to change settings like environment and logging.
By following these steps, we can install Puppet and get it ready for our configuration and management tasks.
Writing Puppet Manifests
We use Puppet manifests as the main part of Puppet configuration management. These manifests are written in Puppet's special language. They show us how we want our infrastructure and resources to be.
Basic Structure of a Manifest
A manifest usually has −
- Classes − These hold the configurations.
- Resources − These show the state we want for system parts like packages, services, and files.
Example of a Simple Manifest
class apache {
   package { 'httpd':
      ensure => installed,
   }

   service { 'httpd':
      ensure => running,
      enable => true,
   }

   file { '/var/www/html/index.html':
      ensure  => file,
      content => 'Welcome to Apache!',
   }
}
Defining Resources
- Resource Types − Some common types are package, service, file, and user.
- Attributes − These tell us about properties like ensure, content, owner, and mode.
Including Classes
To use a class for a node, we can write the include statement −
include apache
Puppet manifests help us make modular and reusable configurations. This makes managing infrastructure easier for us.
Managing Puppet Modules
We can think of Puppet modules as groups of files that help us manage parts of a system. They include manifests, templates, files, and other things. Using Puppet modules helps us reuse our code and keep it organized. Here is how we can manage Puppet modules well −
Module Structure
A Puppet module usually looks like this −
my_module/
 manifests/
    init.pp
 templates/
 files/
 metadata.json
Creating a Module
We can create a new module using the Puppet module tool like this −
puppet module generate my_module
Managing Dependencies
We need to list our dependencies in the metadata.json file. Here is an example −
{
   "name": "my_module",
   "version": "0.1.0",
   "dependencies": [
      {
         "name": "puppetlabs-apt",
         "version_requirement": ">= 7.0.0"
      }
   ]
}
Installing Modules
To get modules from the Puppet Forge, we can use this command −
puppet module install <module_name>
Updating Modules
When we want to update our modules, we just run −
puppet module update <module_name>
Module Versioning
We should always use version control like Git for our modules. This helps us keep track of changes and work together better.
By managing Puppet modules in a good way, we can make sure our infrastructure as code is modular, easy to maintain, and can grow when we need it to.
Puppet Environment and Classifying Nodes
We use Puppet environments to manage different setups for each stage of our deployment pipeline. This includes development, testing, and production. Each environment can have its own manifests and modules. This helps us test and develop in isolation.
Setting up Puppet Environments
Directory Structure:
We need to create separate folders for each environment under −
/etc/puppetlabs/code/environments/:
 	/etc/puppetlabs/code/environments/
   production/
   development/
Puppet Configuration: We should change puppet.conf to specify which environment we are using −
 	[main]
environment = production
Classifying Nodes
Node classification is very important. It helps us apply the right configurations to the right nodes. Puppet Enterprise gives us a GUI for classification. Puppet can also use a node definition in manifests.
Example Node Definition
node 'webserver' {
   include apache
}

node 'dbserver' {
   include mysql
}
Using External Node Classifiers (ENC)
For complex setups, we can use an ENC like Foreman or Hiera. These tools can dynamically assign classes based on node facts or data from outside. This makes our work more flexible and easier to manage.
Integrating Puppet with CI / CD Pipelines
We can make software delivery better by integrating Puppet with CI/CD pipelines. Puppet helps us automate and keep things consistent. We can use Puppet in different stages of the CI/CD process to manage and set up environments easily.
Let's see the key steps for this integration −
- Version Control − We should store Puppet manifests and modules in a version control system like Git. This helps us track changes and work together better.
- CI/CD Tools − We can use tools like Jenkins, GitLab CI, or CircleCI to start Puppet runs. We need to set up build jobs to apply Puppet manifests when we deploy.
- Puppet Agent and Server − The Agent automatically gets configurations from the Puppet Master. The Server: It sends updates when we commit code.
- Environment Management − Let's use Puppet environments to keep configurations separate for development, testing, and production.
Example Jenkins Pipeline Snippet
pipeline {
    agent any
    stages {
        stage('Deploy') {
            steps {
                script {
                    sh 'puppet apply /path/to/manifests'
                }
            }
        }
    }
}
Conclusion
In this chapter, we looked at the basics of DevOps. We focused on Puppet. We talked about Puppets architecture and how to install it. We also shared how to create manifests and modules.
We discussed how to manage environments and classify nodes. We looked at how to connect Puppet with CI/CD pipelines.
DevOps - Ansible
Ansible is a powerful tool that helps us automate tasks. It makes configuration management and application deployment easier. So, it is a key resource for DevOps.
In this chapter, we will look at Ansible's structure. We will talk about key ideas like inventories and playbooks. We will also learn how to set it up for good DevOps use. We will discuss how to write good playbooks and how to use Ansible for continuous integration and deployment.
Understanding Ansible Architecture
We know that Ansible is a free tool for automation. It uses a client-server setup and mainly works without a master. Its setup has some important parts:
- Control Node − This is the machine where we install Ansible. We start tasks from here. It runs playbooks and talks to the managed nodes.
- Managed Nodes − These are the machines where Ansible does its work. They can be real servers, virtual machines, or cloud instances. We do not need to install any agents on these nodes. Ansible uses SSH to communicate.
- Inventory − An inventory file shows all the managed nodes. It can be static like INI or YAML format. It can also be dynamic if we pull it from cloud providers or other places.
- Modules − Ansible has many modules that do specific tasks. They can install packages, copy files, or manage services. We can also create our own modules.
- Playbooks − These are YAML files. They tell us what we want the managed nodes to be like. They list the tasks to do and the order to do them.
- Plugins − Ansible can be extended with plugins. These can change how it works or add new features. For example, we have connection, action, or filter plugins.
By using this setup, Ansible is simple and can grow easily. This makes it a great choice for DevOps practices.
Ansible Inventories
We use inventories in Ansible to show the hosts and groups of hosts where we will run tasks. An inventory can be static, like a simple text file, or dynamic, which is made by a script.
Static Inventory Example
A static inventory is usually in a file, like hosts.ini −
[webservers]
web1.example.com
web2.example.com

[databases]
db1.example.com
Dynamic Inventory
We can get dynamic inventories from cloud providers or other sources. For example, when we use AWS −
ansible-cmd -i aws_ec2.py all -m ping
Ansible Playbooks
We use Ansible playbooks as YAML files. They help us define a set of tasks that we want to run on our hosts. Playbooks are very important for automating tasks. They help us do things in a repeatable and organized way. Each playbook has one or more plays. These plays connect our hosts to the tasks we want to perform.
Structure of a Playbook
---
- name: Playbook Example
  hosts: webservers
  tasks:
    - name: Install Apache
      yum:
        name: httpd
        state: present

    - name: Start Apache
      service:
        name: httpd
        state: started
Key Components
- Hosts − These are the target machines we define in inventory.
- Tasks − These are the actions we need to do. We use modules for this.
- Modules − These are built-in or custom scripts. For example, yum and service are modules we use to run tasks.
Playbooks are very important for managing complex workflows. They help us keep configurations consistent across different environments.
Ansible Roles
Roles help us organize Ansible code better. A role can have tasks, handlers, variables, and templates. This makes it easy to use the same role in different playbooks.
Role Directory Structure
my_role/
   tasks/
      main.yml
   handlers/
      main.yml
   vars/
      main.yml
   templates/
       config.j2
These ideas inventories, playbooks, and roles make the main parts of Ansible's configuration management and automation.
Setting Up Ansible for DevOps
We can set up Ansible for DevOps by following some simple steps. This will help us with configuration management and deployment.
Here are the prerequisites −
- Ansible works best on Linux. We need to make sure we have a compatible OS.
- Ansible needs Python to run. We can install it using our package manager like apt or yum.
Installation Using Package Managers (like for Ubuntu) −
sudo apt update
sudo apt install ansible
Installation Using pip (Python package manager) −
pip install ansible
Verify Installation using the following command −
ansible --version
Configuration
Inventory file − We need to define our hosts in /etc/ansible/hosts or in a custom file −
[webservers]
web1.example.com
web2.example.com
Ansible.cfg: We can change some settings in ansible.cfg −
[defaults]
inventory = ./inventory
remote_user = your_user
SSH Access
We have to make sure we can access our managed nodes without a password −
ssh-keygen -t rsa
ssh-copy-id user@node
This setup helps us use Ansible to automate tasks on many servers easily.
Writing Effective Playbooks
We know that Ansible playbooks are YAML files. They define the automation tasks we want to run on managed nodes. When we write effective playbooks, we make them easier to read, reuse, and maintain.
Here are some important tips:
- Pick clear descriptive names for your playbooks. This helps us understand what each playbook does.
- Organize the playbooks well. We can use roles to group tasks. This makes everything neat.
- Define variables in a separate vars If you have sensitive info, then use Ansible Vault. Here is an example −
vars:
app_version: "1.0.0"
Make sure the playbooks can run many times. They should not change the system state if it is not needed. Use Ansible modules that are idempotent.
Use handlers to manage services. They only notify when a change happens. Here is an example −
handlers:
  - name: restart web server
    service:
      name: httpd
      state: restarted
Add comments to explain complex tasks or logic. For example −
# Install the latest version of nginx
- name: Install nginx
  yum:
    name: nginx
    state: latest
By following these tips, we can make efficient and easy-to-manage Ansible playbooks. This will help us in our DevOps work.
Using Ansible for Continuous Integration and Deployment
We can use Ansible to make Continuous Integration (CI) and Continuous Deployment (CD) easier. Ansible helps us set up and manage environments, deploy applications, and run tests automatically. Here is how we can put Ansible into our CI/CD pipelines.
Using Ansible, we can run playbooks many times without changing the result after the first run. This makes our deployments more predictable.
Ansible does not need agents on target machines. This helps us keep things simple.
Workflow Example
Environment Setup − We can use Ansible to set up and configure environments automatically −
- hosts: all
  tasks:
    - name: Install Docker
      apt:
        name: docker.io
        state: present
Code Deployment − We can deploy our application code using playbooks −
- hosts: webservers
  tasks:
    - name: Deploy application
      copy:
        src: /local/path/to/app
        dest: /var/www/app
Testing − We can run tests automatically after we deploy −
- hosts: testservers
  tasks:
    - name: Run tests
      command: /path/to/test_script.sh
Integration with CI/CD Tools
- Jenkins − We can use the Ansible plugin to run playbooks as build steps.
- GitLab CI − We can call Ansible from .gitlab-ci.yml to automate our deployment.
By using Ansible in our CI/CD, we can deliver software faster and more reliably. It also helps us to reduce the need for manual work.
Conclusion
In this chapter, we looked at the basics of Ansible. We talked about its structure and important ideas like inventories, playbooks, and roles. We also showed how to set it up for DevOps environments.
It is important to write good playbooks and manage configurations well. Ansible helps us with continuous integration and deployment. With Ansible, we can make automation better. We can also make workflows easier and improve how we work in software development.
DevOps - Kubernetes
Kubernetes helps us automate how we deploy, scale, and manage containerized applications. This makes it an important tool for us in DevOps.
In this chapter, we will look at the basics of Kubernetes. We will talk about its architecture and how we can set up a cluster. We will also discuss how to deploy applications, manage configurations, integrate CI/CD, and strategies for monitoring.
Understanding Kubernetes Architecture
We can think of Kubernetes architecture like a master-slave setup. It has many parts that work together to manage applications in containers. The main parts are:
1. Control Plane
- API Server − This is the front part of the Kubernetes control plane. It handles all the REST operations.
- Scheduler − This helps assign workloads to nodes. It looks at what resources are available and follows certain rules.
- Controller Manager − This manages controllers that keep the cluster's state in check. For example, it works with the replication controller.
- etcd − This is a distributed key-value store. It keeps all the cluster data and is the main source of truth.
2. Worker Nodes
Worker Nodes run the applications. They have −
- Kubelet − This is an agent that talks with the control plane. It manages the lifecycles of containers.
- Kube Proxy − This takes care of network routing and load balancing for services.
- Container Runtime − This is the software that runs containers. Examples include Docker and containerd.
3. Networking
Kubernetes networking helps pods and services talk to each other. It uses:
- Cluster IP − This is the internal IP for accessing services.
- NodePort − This exposes a service on a fixed port on each node's IP.
- LoadBalancer − This works with cloud providers to set up a load balancer for the service.
We need to understand this architecture well. It helps us manage and deploy applications in Kubernetes effectively.
Setting Up a Kubernetes Cluster
We can set up a Kubernetes cluster in a few steps. We can do this on local machines, cloud services, or on our own servers. Here, we will show the steps to set up a Kubernetes cluster using kubeadm. This is a common tool for starting the cluster.
Following are the prerequisites −
- Operating System − We need Ubuntu, CentOS, or other Linux systems.
- Hardware − Each node should have at least 2 CPUs and 2GB of RAM.
- Docker − We must install Docker and make sure it is running to manage container images.
Steps to Set Up a Kubernetes Cluster
Install Kubernetes Components − First, we run these commands −
sudo apt-get update
sudo apt-get install -y apt-transport-https ca-certificates curl
curl -s https://packages.cloud.google.com/apt/doc/apt-key.gpg | sudo apt-key add -
echo "deb https://apt.kubernetes.io/ kubernetes-xenial main" | sudo tee /etc/apt/sources.list.d/kubernetes.list
sudo apt-get update
sudo apt-get install -y kubelet kubeadm kubectl
sudo apt-mark hold kubelet kubeadm kubectl
Initialize the Cluster − On the master node, we run −
sudo kubeadm init --pod-network-cidr=192.168.0.0/16
Set Up Local Kubeconfig − We need to set up the kubeconfig for our user −
mkdir -p $HOME/.kube
sudo cp -i /etc/kubernetes/admin.conf $HOME/.kube/config
sudo chown $(id -u):$(id -g) $HOME/.kube/config
Install a Pod Network Add-on (like Calico) − We can install Calico with this command −
kubectl apply -f https://docs.projectcalico.org/manifests/calico.yaml
Join Worker Nodes − For each worker node, we use the token from the initialization step −
kubeadm join <master-ip>:6443 --token <token>
   --discovery-token-ca-cert-hash sha256:<hash>
Verification − To check the status of the nodes, we run −
kubectl get nodes
This command shows us the status of the master and worker nodes. This way, we can confirm that we have set up our Kubernetes cluster correctly.
Deploying Applications on Kubernetes
We can deploy applications on Kubernetes by defining how the application should look using Kubernetes manifests. We usually write these manifests in YAML. The most common resources we use for deployment are Pods, ReplicaSets, and Deployments. In this section, we will discuss the key steps for deployment −
Create a Deployment − We need to define what our application should look like in a Deployment manifest.
apiVersion: apps/v1
kind: Deployment
metadata:
  name: my-app
spec:
  replicas: 3
  selector:
    matchLabels:
      app: my-app
  template:
    metadata:
      labels:
        app: my-app
    spec:
      containers:
      - name: my-app-container
        image: my-app-image:latest
        ports:
        - containerPort: 80
Apply the Manifest − We use kubectl to apply the deployment −
kubectl apply -f deployment.yaml
Expose the Application − We create a Service to let outside traffic reach our application.
apiVersion: v1
kind: Service
metadata:
  name: my-app-service
spec:
  type: LoadBalancer
  ports:
    - port: 80
      targetPort: 80
  selector:
    app: my-app
Verify Deployment − We check the status of our Pods and Services −
kubectl get pods
kubectl get services
By following these steps, we can successfully deploy and manage applications on a Kubernetes cluster.
Managing Configurations and Secrets
In Kubernetes, we see that configurations and secrets are very important. They help us manage app settings and keep sensitive data safe. Kubernetes gives us ConfigMaps to handle non-sensitive configuration data. It also gives us Secrets for sensitive information like passwords or API keys.
ConfigMaps
ConfigMaps hold configuration settings as key-value pairs. We can create ConfigMaps from files, folders, or direct values.
kubectl create configmap my-config --from-literal=key1=value1
   --from-file=my-config-file.conf
Usage in Pods − We can mount ConfigMaps as volumes or use them as environment variables.
apiVersion: v1
kind: Pod
metadata:
  name: my-pod
spec:
  containers:
  - name: my-container
    image: my-image
    env:
    - name: CONFIG_KEY
      valueFrom:
        configMapKeyRef:
          name: my-config
          key: key1
Secrets
Secrets keep sensitive data safe. They are encoded in Base64. We create Secrets like ConfigMaps but use the kubectl create secret command.
kubectl create secret generic my-secret --from-literal=password=my-password
Usage in Pods − Secrets can also be mounted as volumes or used as environment variables.
apiVersion: v1
kind: Pod
metadata:
  name: my-secure-pod
spec:
  containers:
  - name: my-secure-container
    image: my-secure-image
    env:
    - name: DB_PASSWORD
      valueFrom:
        secretKeyRef:
          name: my-secret
          key: password
Implementing CI/CD Pipelines with Kubernetes
We know Continuous Integration (CI) and Continuous Deployment (CD) pipelines are very important in DevOps. They help us automate how we deliver applications. Kubernetes makes CI/CD better by giving us a strong platform to deploy, manage, and scale our applications.
Key Components
- Source Control − We use Git repositories to store our application code.
- CI/CD Tools − The tools that we use include: Jenkins, GitLab CI, and ArgoCD.
- Container Registry − We can use Docker Hub or private registries to keep our images.
CI/CD Process
Code Commit − We push code changes to the repository.
Build Stage − Our CI tools build Docker images.
docker build -t myapp:latest .
Test Stage − Automated tests run to check our code.
Push to Registry − We push successful builds to a container registry.
docker push myapp:latest
Deployment − We use Kubernetes manifests (YAML files) for deployment.
 	apiVersion: apps/v1
kind: Deployment
metadata:
  name: myapp
spec:
  replicas: 3
  selector:
    matchLabels:
      app: myapp
  template:
    metadata:
      labels:
        app: myapp
    spec:
      containers:
      - name: myapp
        image: myapp:latest
Tools for CI/CD on Kubernetes
- Helm − It is a package manager for Kubernetes.
- Tekton − This is a Kubernetes-native CI/CD framework.
- ArgoCD − We use this GitOps continuous delivery tool.
By putting all these parts together, we can make our software deployment process in Kubernetes automated, efficient, and reliable.
Monitoring and Logging in Kubernetes
We know that good monitoring and logging are very important for keeping Kubernetes clusters healthy and working well. These tools help us find problems, check performance, and fix issues quickly.
Monitoring Tools
- Prometheus − It is an open-source tool for monitoring and alerting. It collects data using a pull model over HTTP. It allows us to work with multi-dimensional data and flexible queries.
- Grafana − This is a tool for visualization that works with Prometheus. We can create dashboards to see our metrics clearly.
- Kube-state-metrics − This tool gives us metrics about the state of Kubernetes objects like deployments and pods. It gives us detailed info for monitoring.
Logging Solutions
- Fluentd − It is a data collector that helps us combine logs from different places. It helps us gather logs from nodes and containers easily.
- Elasticsearch & Kibana − Elasticsearch stores the logs. Kibana helps us visualize them. These tools are great for searching and checking logs.
Example Prometheus Configuration
apiVersion: v1
kind: ConfigMap
metadata:
  name: prometheus-config
data:
  prometheus.yml: |
    global:
      scrape_interval: 15s
    scrape_configs:
      - job_name: 'kubernetes-nodes'
        kubernetes_sd_configs:
          - role: node
Conclusion
In this chapter, we looked at the basics of Kubernetes. We talked about its structure, how to set up a cluster, deploy applications, manage configurations, integrate CI/CD, and monitor systems.
DevOps - Jira
JIRA is a well-known project management tool. It helps us work together better by offering features that fit agile development and improve how we run operations.
In this chapter, we will see how we can use JIRA in a DevOps setup. We will look at how to set it up, how to connect it with CI/CD tools, and we will share some best tips for managing workflows and incidents.
Understanding JIRA in a DevOps Context
We all know JIRA. It is a popular tool by Atlassian for tracking issues and projects. JIRA is very important for DevOps practices. It helps connect development and operations teams. This tool gives a single place to manage tasks, issues, and projects.
Key Features of JIRA in DevOps
- Issue Tracking − We can create, track, and manage issues during the development cycle with JIRA.
- Agile Methodologies − JIRA supports Scrum and Kanban. This helps our teams manage backlogs and sprints better.
- Collaboration − JIRA improves communication between developers, QA, and operations. It helps us work together better.
- Customizable Workflows − We can set up workflows to fit our own processes. This makes task management more efficient.
- Integration − JIRA works well with many CI/CD tools like Jenkins and GitLab. It also connects with monitoring tools like Splunk and New Relic.
Setting Up JIRA for DevOps Teams
We can set up JIRA for DevOps teams by following some simple steps.
- Project Creation − First, we create a new project in JIRA. We should pick a template that fits our team's workflow. We can choose from Scrum, Kanban, or a custom template.
- User Roles and Permissions − Next, we define user roles. For example, Developer, Tester, and DevOps Engineer. We then set permissions for each role. This way, team members can access what they need without any security issues.
| Role | Permissions |
|---|---|
| Developer | Create, Edit, Transition |
| Tester | View, Comment, Transition |
| DevOps Engineer | Admin, Manage Releases |
- Issue Types − We customize issue types. This helps us reflect tasks, bugs, and user stories that fit our DevOps process.
- Custom Fields − We add fields like Deployment Date, Environment, and Build Number. These fields help us track important DevOps information.
- Boards Configuration − We set up Scrum or Kanban boards. This helps us see our workflow and track tasks in real time.
- Notifications − We configure notification schemes. This keeps the team updated about any changes or updates.
- Integrations − We make sure JIRA works with tools like Git, Jenkins, and CI/CD pipelines. This makes our collaboration easier.
By following these steps, we can make sure our JIRA setup is ready for a DevOps team. This will help us boost our productivity and work better together.
Integrating JIRA with CI/CD Tools
We can make our work easier by integrating JIRA with Continuous Integration (CI) and Continuous Deployment (CD) tools. This connection helps us automate many tasks. It also helps us keep track of issues, builds, and deployments. This way, our development team stays in sync with project management.
Common CI/CD Tools to Integrate with JIRA
- Jenkins − We can use the JIRA plugin for Jenkins. It will automatically update JIRA issues based on build results.
- GitLab CI/CD − We can set up JIRA integration in GitLab settings. This will link commits and merge requests to JIRA issues.
- CircleCI − We can use the JIRA API. This allows us to create links to issues from build and deployment statuses.
Example Configuration for Jenkins
- Install JIRA Plugin − In Jenkins, we go to Manage Jenkins > Manage Plugins, and we install the JIRA plugin.
- Configure JIRA Site − Next, we go to Manage Jenkins > Configure System. Here we add our JIRA site URL and credentials.
- Post-Build Action − In our Jenkins job configuration, we add a post-build action. This action will update JIRA issues with the build results.
By integrating JIRA with CI/CD tools, we can make sure that all our development work is tracked. This helps us meet project goals and supports a better DevOps culture.
Installing JIRA in a DevOps Workflow
Setting up JIRA in a DevOps workflow helps manage projects and track issues effectively. It integrates well with development and operations tools. Let’s go step by step.
1. Prerequisites
- Server or Cloud Instance − Choose between JIRA Cloud or hosting it yourself.
- System Requirements (for Self-Hosted) − Make sure your server meets the JIRA hardware and software requirements.
- Database − Get a compatible database ready, like PostgreSQL, MySQL, or Oracle, for self-hosting.
2. Installation Steps for Self-Hosted JIRA
Step 1 − Download JIRA Software − Go to the Atlassian JIRA Download page. Download the installer for your OS (Linux, Windows, or macOS).
Step 2 − Install JIRA − On Linux, use the .bin file −
sudo chmod a+x atlassian-jira-software-x.x.x-x64.bin
Run the installer −
./atlassian-jira-software-x.x.x-x64.bin
Follow the steps for port and directory setup.
On Windows, run the installer. Follow the prompts on the screen. Set it to run as a service if needed.
On Docker, pull the image −
docker pull atlassian/jira-software
Run the container −
docker run -d -p 8080:8080 --name jira -v jiraVolume:/var/atlassian/application-data/jira atlassian/jira-software
Step 3 − Configure the Database − Use the setup wizard to pick your database. Add database connection settings via a .properties file or the UI.
Step 4 − Licensing and Setup − Open the setup wizard in your browser at http://<your-server-ip>:8080. Enter the license key from Atlassian's website. Create an admin account and set up your project defaults.
3. Integration with DevOps Tools
- JIRA and CI/CD Tools − Link JIRA with Jenkins, GitLab, or GitHub to automate workflows. Example − In Jenkins, use the JIRA plugin to update issues after builds.
- JIRA and SCM − Connect repositories like GitHub or Bitbucket to track changes. Add JIRA issue keys in commit messages to link them automatically.
- JIRA and Incident Management − Use tools like PagerDuty or Opsgenie to sync incidents and alerts with JIRA
Configuring Workflows for Agile Practices
We know that configuring workflows in JIRA for Agile practices is very important. It helps us make our processes smoother and improves how we work together as a team. JIRA gives us the ability to change workflows. We can fit them to our own Agile methods like Scrum or Kanban.
Key Steps to Configure Agile Workflows
- Define Workflow Stages − Find out the stages of your Agile process. For example, To Do, In Progress, Code Review, Done.
- Create a New Workflow − Go to JIRA Administration > Issues > Workflows. Then, click on Add Workflow. Here you can set your stages and how they connect.
- Set Transitions − Define how issues move between stages. For example, from “In Progress” to “Code Review”. Use conditions, validators, and post-functions to manage these transitions.
- Assign Workflow to a Project − We go to Project Settings > Workflows. Then we link our custom workflow to the project we want.
Example Workflow Configuration
| Status | Description |
|---|---|
| To Do | Issues waiting to be picked up |
| In Progress | Currently being worked on |
| Code Review | Undergoing code review |
| Done | Completed tasks |
Tips for Effective Agile Workflows − Use Swimlanes to see work in progress better. Use Sprints in Scrum to manage our time-boxed work. Apply Automation Rules to cut down manual updates and make our work faster.
By setting up workflows in JIRA the right way, you can help your Agile teams work better.
Conclusion
In this chapter, we looked at how we can use JIRA in a DevOps framework. We talked about how to set it up, how to configure the workflow, and how to connect it with CI/CD tools. We also shared its part in managing incidents and why reporting and metrics are important.
DevOps - ELK
Good log management and data visualization help us keep our systems running well and reliable. The ELK Stack is a great tool for this. It includes Elasticsearch, Logstash, and Kibana. This stack helps us collect, analyze, and show log data from many different sources.
In this chapter, we will look at the parts of the ELK Stack. We will also see how we can set it up for better log management. This setup will help us connect easily with CI/CD pipelines and follow best practices in our DevOps work.
ELK Stack in DevOps
ELK Stack has three main tools: Elasticsearch, Logstash, and Kibana. This stack is really helpful for logging and showing data in DevOps. We can use it to collect, look at, and display log data from many places. This helps us fix problems faster and keep an eye on performance.
Components of the ELK Stack
Following are the three components of the ELK Stack −
- Elasticsearch − This is a tool that helps us search and analyze data. It stores and organizes log data. This way, we can search quickly and gather information easily.
- Logstash − It is like a pipeline for data. It takes data from different sources, changes it, and sends it to Elasticsearch. Logstash can take many kinds of data, like logs, metrics, and events.
- Kibana − This is a tool we use on the web to see our data. It helps us create dashboards, charts, and graphs. With Kibana, we can visualize our log data in a simple way.
Setting Up Elasticsearch for Log Management
We know that Elasticsearch is a distributed search and analytics engine. It is very important for the ELK Stack. To set up Elasticsearch for log management, we can follow these simple steps.
Elasticsearch Installation
For Debian or Ubuntu, use the following commands −
wget https://artifacts.elastic.co/downloads/elasticsearch/elasticsearch-7.x.x-amd64.deb
sudo dpkg -i elasticsearch-7.x.x-amd64.deb
For RPM-based systems, we can run these commands −
wget https://artifacts.elastic.co/downloads/elasticsearch/elasticsearch-7.x.x-x86_64.rpm
sudo rpm -ivh elasticsearch-7.x.x-x86_64.rpm
Start Elasticsearch − We can start Elasticsearch with this command −
sudo service elasticsearch start
Elasticsearch Configuration
Edit elasticsearch.yml − Find this file in /etc/elasticsearch/. Change it like this −
network.host: localhost
http.port: 9200
cluster.initial_master_nodes: ["node-1"]
Verify Installation
Check if Elasticsearch is running. We can do that with this command −
curl -X GET "localhost:9200/"
Index Creation
Now we create an index for log management. We can run this command −
curl -X PUT "localhost:9200/logs/"
This setup helps Elasticsearch to collect, store and manage logs well. It also allows us to search and analyze data in a powerful way.
Configuring Logstash for Data Ingestion
We know that Logstash is a strong tool for processing data. It takes data from different places, changes it, and sends it to a place we choose, like Elasticsearch. To set up Logstash, we need to define input, filter, and output plugins in a configuration file.
Basic Configuration Structure
A standard Logstash configuration file has three main parts −
input {
   # Define input sources
   beats {
      port => 5044
   }
}

filter {
   # Data transformation
   grok {
      match => { "message" => "%{COMBINEDAPACHELOG}" }
   }
   date {
      match => [ "timestamp", "dd/MMM/yyyy:HH:mm:ss Z" ]
   }
}

output {
   # Define output destination
   elasticsearch {
      hosts => ["http://localhost:9200"]
      index => "logs-%{+YYYY.MM.dd}"
   }
}
Note the following Key Points −
- Use Input Plugins to confirm where the data comes from (like Beats, Kafka, or files).
- Filter Plugins help us change the data (like parsing or adding information).
- Use Output Plugins to send data to where we want (like Elasticsearch or files).
Example Input Plugin
For getting input from files, we can use −
input {
   file {
      path => "/var/log/myapp/*.log"
      start_position => "beginning"
   }
}
Running Logstash
To start Logstash with our configuration, we can run −
bin/logstash -f path/to/your/logstash.conf
This setup allows Logstash to take logs, process them, and send them to Elasticsearch for more checking.
Using Kibana for Data Visualization
We can use Kibana as a strong tool for visualization. It works very well with Elasticsearch. It helps us explore and show our data in a simple way. We can easily create interactive dashboards, charts, and graphs with its easy-to-use interface.
Following are the Key Features of Kibana −
- Dashboards − We can combine many visualizations into one view. This gives us a complete look at our data.
- Visualizations − We can create different types of visualizations. This includes line charts, pie charts, and maps.
- Search and Filtering − We can use the Lucene query language. This helps us search and filter our logs in a better way.
Getting Started with Kibana
First of all, let's install Kibana −
sudo apt-get install kibana
Next, you need to configure Kibana. We need to change the kibana.yml file to connect it to our Elasticsearch −
server.port: 5601
server.host: "0.0.0.0"
elasticsearch.hosts: ["http://localhost:9200"]
Now let's start Kibana −
sudo service kibana start
To access Kibana, open your browser and go to http://localhost:5601.
Creating Visualizations
You can use the Visualize tab to choose the type of visualization you want. Then, pick the index pattern that matches our data. Next, set up metrics and buckets. It would help you decide how to show and group the data.
By using Kibana, you can get real-time insights into how your applications perform and look at log data.
Integrating ELK Stack with CI / CD Pipelines
We can make our monitoring and troubleshooting better by adding the ELK Stack to our CI/CD pipelines. This gives us real-time views of application logs and performance data. Here is how we can add ELK components to our CI/CD workflow −
- Continuous Log Collection − We can use Logstash or Filebeat to get logs from our applications during the build and deployment stages. We should format logs the same way so they are easier to read.
- Automated Data Ingestion − Let's set up Logstash to take in logs from different sources automatically −
input {
   beats {
      port => 5044
   }
}
filter {
   # Example filter for parsing application logs
   grok {
      match => { "message" => "%{COMBINEDAPACHELOG}" }
   }
}
output {
   elasticsearch {
      hosts => ["http://localhost:9200"]
      index => "app-logs-%{+YYYY.MM.dd}"
   }
}
- Dashboard Creation − We can use Kibana to make dashboards that show application performance and error rates. We should automate how we deploy Kibana dashboards in our CI/CD pipeline.
- Alerting − We need to set up alerts in Kibana or use Elasticsearch Watcher. This will help us tell teams about serious issues when we deploy.
- Feedback Loop − We can use the logs and metrics from ELK to keep improving our CI/CD process.
By doing these steps, we can have a strong integration of the ELK Stack in our CI/CD pipelines. This will help us see more clearly and respond to problems faster.
Conclusion
In this chapter, we looked at the important parts of the ELK Stack. These parts are Elasticsearch, Logstash, and Kibana. They play a big role in making DevOps better.
We set up Elasticsearch for managing logs. We also configured Logstash for taking in data. Then, we used Kibana for showing the data in a clear way. By putting the ELK Stack together with CI/CD pipelines, we showed how it can help us with monitoring and fixing problems.
DevOps - Terraform
In this chapter, we will look at the basic ideas of Terraform. We will talk about its structure, configuration files, and how we manage state. We will also look at why using Terraform modules is good for reusability. We will see how we can use Terraform in CI/CD pipelines. Finally, we will share best practices to make the most of Terraform in our DevOps workflows.
Understanding Infrastructure as Code (IaC)
Infrastructure as Code or IaC is an important DevOps practice. It helps us manage our infrastructure with code instead of doing things by hand. With IaC, we can define, create, and manage our infrastructure using easy configuration languages. This gives us more consistency, repeatability, and the ability to grow.
Common IaC Tools
Here are some of the common IaC tools −
- Terraform − A tool for building, changing, and tracking infrastructure.
- Ansible − A tool for managing configurations and orchestration.
- CloudFormation − A special IaC tool for AWS to set up resources.
When we use IaC, we can have faster deployment cycles and better management of our infrastructure.
Terraform Architecture and Components
We will discuss how Terraform works. It uses a client-server structure with some important parts. This helps us manage our infrastructure better.
Following are the key components of Terraform architecture:
- Terraform CLI is the command-line tool we use to run Terraform commands. We can manage our infrastructure and work with configuration files here.
- Providers are plugins that help Terraform connect with different cloud services like AWS, Azure, or Google Cloud. Each provider has its own resources that we can use.
- Resources are the basic building blocks in Terraform. They represent services in the cloud or parts of infrastructure. For example, we can create EC2 instances or S3 buckets. Here is a sample configuration −
resource "aws_instance" "example" {
   ami = "ami-0c55b159cbfafe01e"
   instance_type = "t2.micro"
}
State Files − These are JSON files that keep track of the current state of our infrastructure. They are very important for linking real-world resources to our configuration.
Modules − These are groups of resources that we use together. They help us reuse code and keep things organized. Here is an example −
module "vpc" {
  source = "./modules/vpc"
  cidr_block = "10.0.0.0/16"
}
Backend − This is where we store our state file. It can be local or remote like S3 or Terraform Cloud. This helps us work together and manage the state.
Understanding these parts is very important for us to use Terraform well in a DevOps setting.
Writing Terraform Configuration Files
We write Terraform configuration files using HashiCorp Configuration Language (HCL). This language is easy for humans to read and also works well for machines. These files help us define the infrastructure resources we want to create and manage.
A Terraform configuration usually has these main parts −
Provider Block − This shows which cloud provider we are using. For example, we can use AWS or Azure.
provider "aws" {
   region = "us-west-2"
}
Resource Block − This part tells us what resources we want to create.
resource "aws_instance" "web" {
   ami = "ami-0c55b159cbfafe1f0"
   instance_type = "t2.micro"
}
Output Block − This shows information after we run the configuration.
output "instance_ip" {
   value = aws_instance.web.public_ip
}
Variables and Inputs
We can define variables to make our configurations easier to reuse −
variable "instance_type" {
   description = "Type of instance"
   default = "t2.micro"
}
We can use these variables in our resource definitions −
resource "aws_instance" "web" {
   ami = "ami-0c55b159cbfafe1f0"
   instance_type = var.instance_type
}
Managing Terraform State
Managing Terraform state is very important. It helps us track the resources that our configurations create and lets us change them correctly. Terraform keeps a state file called terraform.tfstate. This file shows the current state of our infrastructure. If we manage it well, we can keep everything consistent and avoid configuration drift.
Let's understand some of its key concepts −
- State File − This is a JSON file. It connects resources in our configurations to the real-world items.
- Remote State − When we store the state file remotely, like in AWS S3, Azure Blob Storage, or Terraform Cloud, it helps us work together better and protects us from losing data.
Best Practices for State Management
Use Remote Backends − This helps us with locking and versioning. Here is an example configuration for AWS S3 −
terraform {
   backend "s3" {
      bucket  = "my-terraform-state"
      key = "terraform.tfstate"
      region = "us-east-1"
      dynamodb_table = "terraform-locks"
   }
}
State Locking − This stops multiple actions at the same time that could mess up the state.
State Encryption − We should make sure sensitive data in the state file is encrypted when it is stored.
State Commands
- terraform state list − This command shows us the resources in the state.
- terraform state show <resource> − This command gives details about a specific resource.
- terraform state rm <resource> − This command removes a resource from the state but does not destroy it.
Terraform Modules and Reusability
Terraform modules as boxes that hold different resources we use together. They help us make parts that we can use again. This makes our code easier to manage and we do not have to write the same thing over and over again.
A module usually has the following three files −
- tf − This file has the resource definitions.
- tf − This file defines the input variables.
- tf − This file shows the outputs from the module.
You can use modules by writing a module block in our Terraform configuration files −
module "vpc" {
   source = "./modules/vpc"
   cidr_block = "10.0.0.0/16"
   availability_zones = ["us-west-2a", "us-west-2b"]
}
Example of a Simple Module
# modules/vpc/main.tf
resource "aws_vpc" "main" {
   cidr_block = var.cidr_block
}
# modules/vpc/variables.tf
variable "cidr_block" {
   description = "CIDR block for the VPC"
   type = string
}
# modules/vpc/outputs.tf
output "vpc_id" {
   value = aws_vpc.main.id
}
Using modules the right way can make our Terraform setups easier and helps us follow good practices in managing our infrastructure.
Implementing Terraform in CI/CD Pipelines
We can use Terraform in CI/CD pipelines to automate how we set up our infrastructure. This helps us keep things consistent and allows us to deploy quickly. Here is a simple way to add Terraform to our CI/CD workflows:
Now let's understand the steps to integrate Terraform −
- First, make sure that your CI/CD tool like Jenkins, GitLab CI, or GitHub Actions can access the right credentials. This will let it talk to our cloud provider.
- Keep your Terraform configuration files in a version-controlled repository like Git. It is a good idea to use environment variables or secret management tools to manage sensitive data like API keys.
- Run terraform plan to make a plan for execution. This shows us what changes will happen without applying them.
terraform init
terraform plan -out=tfplan
We can add a step for manual approval for important changes. Then, run terraform apply to set up the infrastructure.
terraform apply tfplan
You should add tests to check if the infrastructure works after you deploy it. If you need to, then clean up resources with terraform destroy.
CI / CD Tool Integration Examples
GitHub Actions −
name: Terraform CI
on:
  push:
    branches:
      - main
jobs:
  terraform:
    runs-on: ubuntu-latest
    steps:
      - name: Checkout code
        uses: actions/checkout@v2
      - name: Set up Terraform
        uses: hashicorp/setup-terraform@v1
        with:
          terraform_version: 1.0.0
      - name: Terraform Init
        run: terraform init
      - name: Terraform Plan
        run: terraform plan
Best Practices for Terraform in DevOps
We need to use Terraform well in a DevOps setting. This means we should follow some best practices. This helps us keep our work easy to manage, grow, and work together. Here are some important tips −
Organize Configuration Files − We should arrange our Terraform files in a clear way. It helps to use different folders for each environment like dev, staging, and prod.
 main.tf
 variables.tf
 outputs.tf
 dev/
    main.tf
 prod/
    main.tf
You can make reusable modules for common parts of your infrastructure. This helps us follow the DRY principle, which means Don't Repeat Yourself.
It is important to use remote state storage like AWS S3 with DynamoDB for locking. This helps us work together safely and avoid problems. Here is an example of a backend setup −
terraform {
   backend "s3" {
      bucket = "my-terraform-state"
      key = "statefile.tfstate"
      region = "us-east-1"
      dynamodb_table = "terraform-locks"
   }
}
You should frequently run terraform fmt and terraform validate commands. This keeps the code quality good and easy to read.
Conclusion
In this chapter, we looked at the important parts of Terraform in the DevOps framework. We talked about Infrastructure as Code (IaC) principles. We also covered Terraform architecture, how to write configurations, state management, module reusability, and how to integrate it into CI/CD pipelines.