- Power BI - Home
- Power BI - Introduction
- Power BI - Installation Steps
- Power BI - Architecture
- Power BI Desktop
- Power BI - Desktop
- Power BI - Desktop Window
- Power BI Service
- Power BI - Window Supported Browsers
- Power BI - Generating Reports
- Power BI Desktop Service
- Power BI - Desktop vs Service
- Power BI - Supported Data Sources
- Power BI - Comparison Tools
- Power Query Editor
- Power Query Editor - Introduction
- Power Query Editor - Data Discrepancy
- Power Query Editor - Merge Queries (Part 1)
- Power Query Editor - Merge Queries (Part 2)
- Power BI - Develop Star Schema
- Data Modeling Concepts
- Power BI - Data Modeling
- Power BI - Manage Relationships
- Power BI - Cardinality
- Power BI - Dashboard Options
- Power BI Report Visualizations
- Power BI - Visualization Options
- Power BI - Visualization Charts
- Power BI - Stacked Bar Chart
- Power BI - Stacked Column Chart
- Power BI - Clustered Chart
- Power BI - 100% Stacked Chart
- Power BI - Area Chart and Stacked Area Chart
- Power BI - Line and Stacked Column Chart
- Power BI - Line and Clustered Column Chart
- Power BI - Ribbon Chart
- Power BI - Table and Matrix Visuals
- Power BI Map Visualizations
- Power BI - Creating Map Visualizations
- Power BI - ArcGIS Map
- Power BI Miscellaneous
- Power BI - Waterfall Charts
- Funnel Charts and Radial Gauge Chart
- Power BI - Scatter Chart
- Power BI - Pie Chart and Donut Chart
- Power BI - Card and Slicer Visualization
- Power BI - KPI Visual
- Power BI - Smart Narrative Visual
- Power BI - Decomposition Tree
- Power BI - Paginated Report
- Power BI - Python Script & R Script
- Power BI - Multi-row Card
- Power BI - Power Apps & Power Automate
- Power BI - Excel Integration
- Power BI Dashboard
- Power BI - Sharing Dashboards
- Power BI Sales Production Dashboard
- Power BI - HR Analytics Dashboard
- Power BI - Customer Analytics Dashborad
- Power BI - DAX Basics
- Power BI - Administration Role
- Power BI - DAX Functions
- Power BI - DAX Text Functions
- Power BI - DAX Date Functions
- Power BI - DAX Logical Functions
- Power BI - DAX Counting Functions
- Power BI - Depreciation Functions
- Power BI - DAX Information Functions
Python Script and R Script Visual
Before working with Python and R script visuals, both software should be installed in your system. You can utilize the Python and R script visual in the BI desktop environment after installing this software.
How to Check if Python is Installed on Your System?
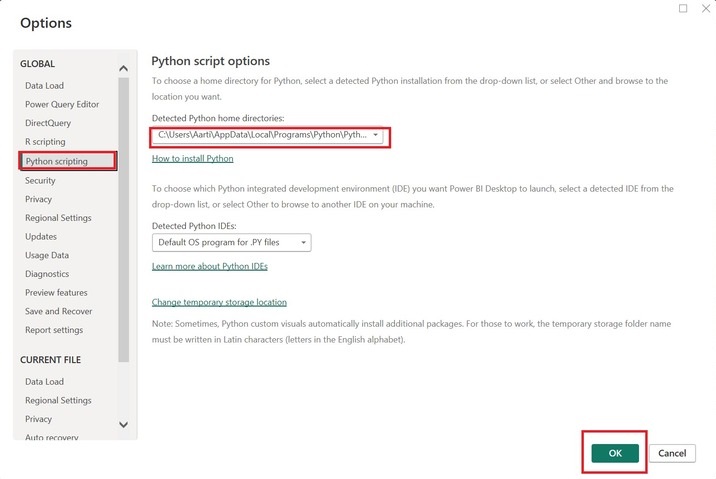
Step 1 − You need to open the BI desktop and navigate to the File tab, click on the Options and Settings, and then choose "Options" where so many options are available.

You can click on the Python scripting and verify the correct path of the Python environment. And then click on the "OK".
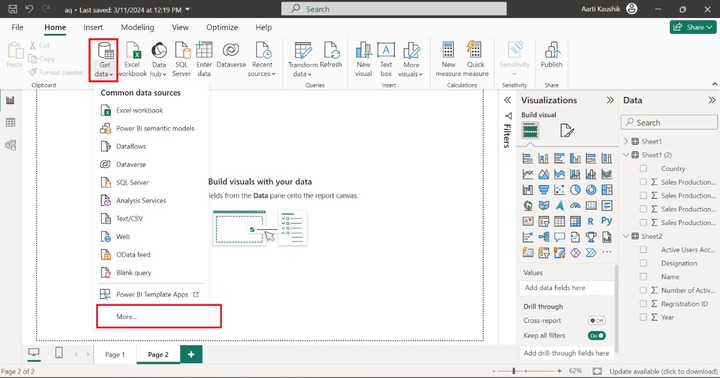
Step 2 − You may select the "Get Data" and then click on the "More...".
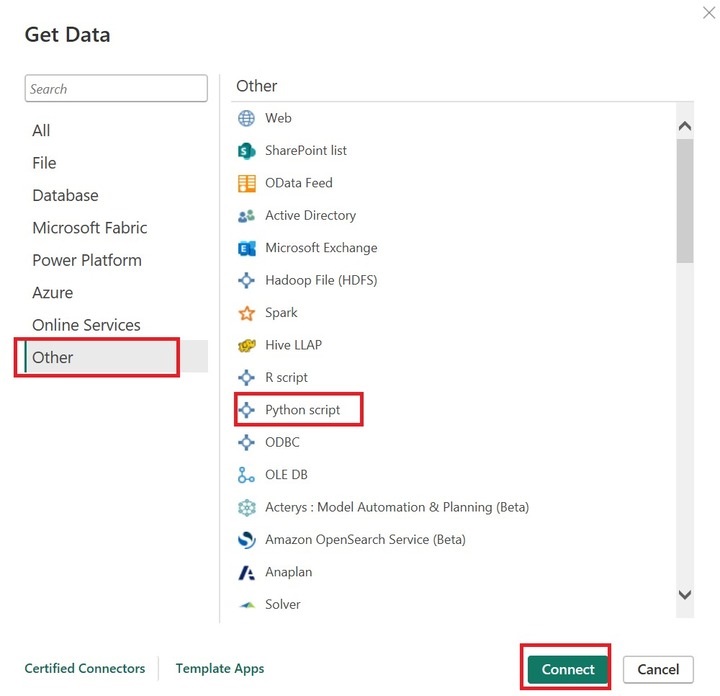
Another "Get Data" dialog box will appear where you may click on the "Other", select the "Python Script" and then click on "Connect".
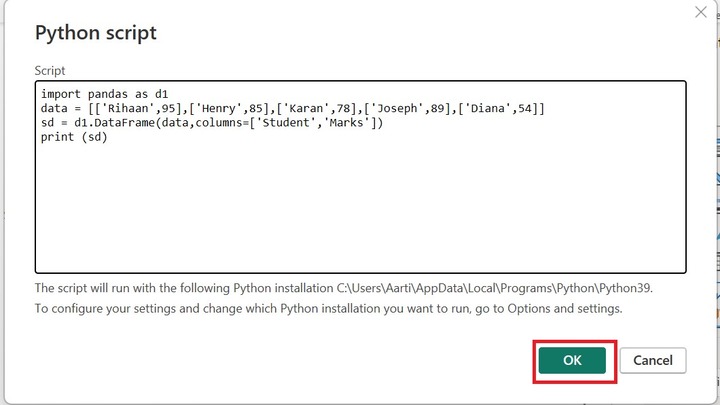
Step 3 − Now, you may enter the following code in the Python script to create two columns named "Student" and "Marks" which consist of five rows and click on "OK".
import pandas as d1
data = [['Rihaan',95],['Henry',85],['Karan',78],
   ['Joseph',89],['Diana',54]]
sd = d1.DataFrame(data,columns=['Student','Marks'])
print (sd)
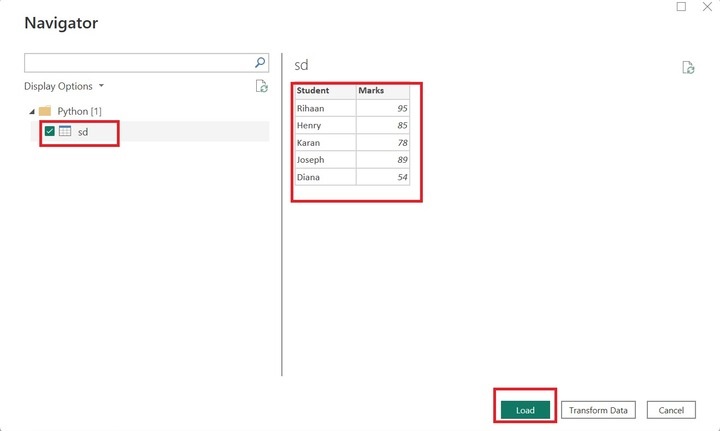
Step 4 − The "Navigator" dialog box will open where you can see the preview of the "sd" table. Moreover, you may click on the "sd" table under Python[1] and click on "Load".
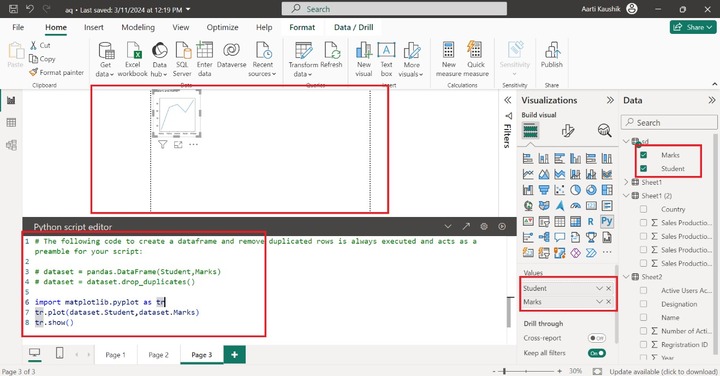
Step 5 − You can select the Python visual from the "Visualizations". The default "Python visual" is displayed on the canvas. But no field values are populated in the visual. To do this, you need to add the desired field values into the Values section.

Step 6 − You can select the "Student", and "Marks" fields under the "Values" section. You need to write the Python code in the Python script editor as highlighted in the screenshot to plot the chart. After writing the code, click on "Run" to deploy the script code.
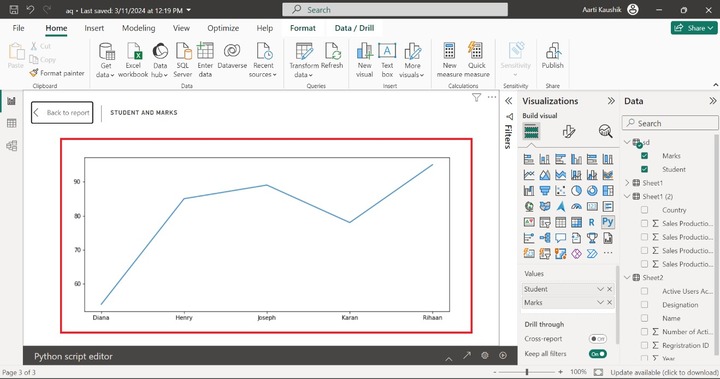
You may click on the focus mode to view the chart which is constructed from the Python visual.
R Script Visual
BI desktop is a powerful tool and compatible to work with extensive libraries of R script language to develop complex charts.
How to Check if R Script is Installed on Your System?
You can click on the BI desktop, navigate to the "File" tab, and click on the "Option and settings".
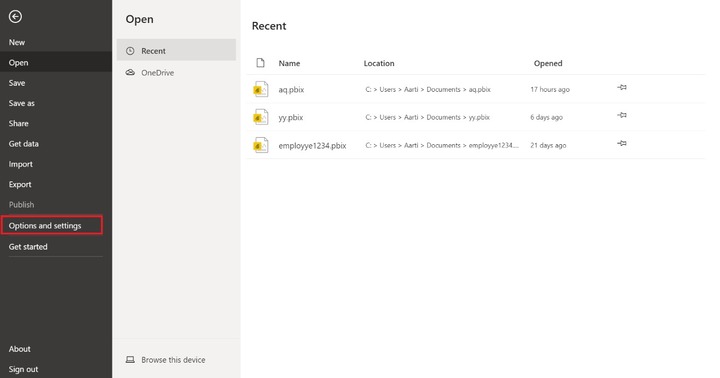
And then you may choose "Options" under "Options and settings".
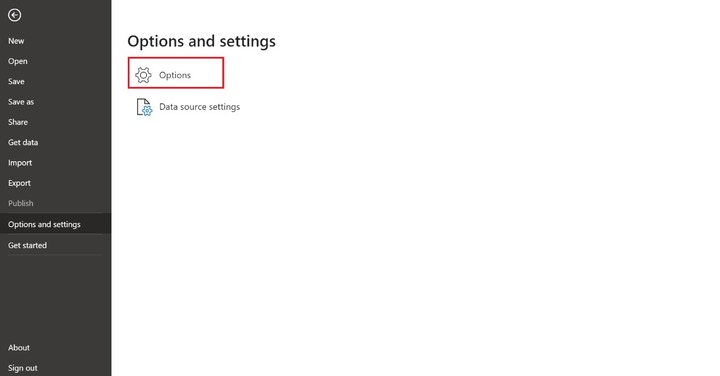
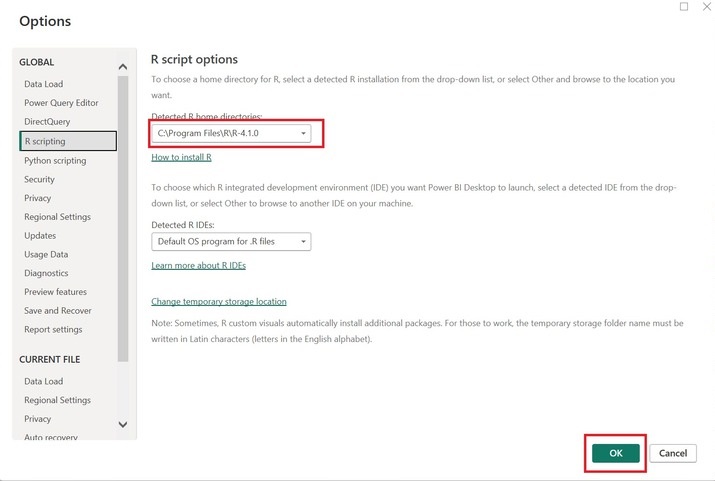
Now, you can choose "R scripting" under "Global", verify the path of the R language, and then click OK.
How to Develop the R visual?
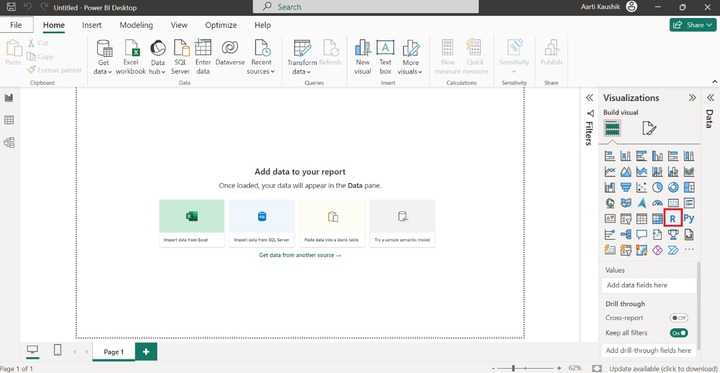
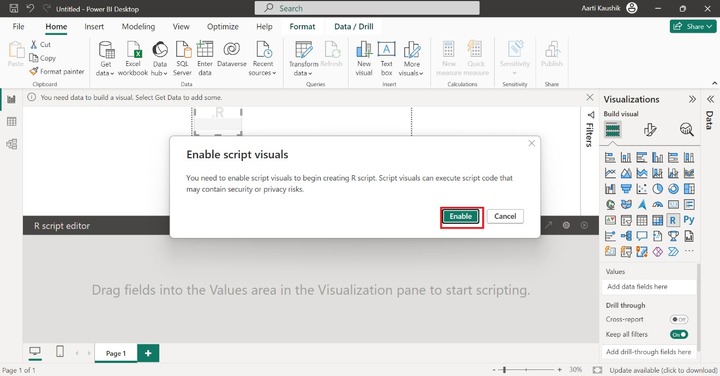
You can open sheet2 of the "C:\Users\Aarti\Documents\aq.pbix" dataset. After that, select the R visual from the Visualization.
Another dialog box "Enable script visuals" appears where you can click on "Enable".
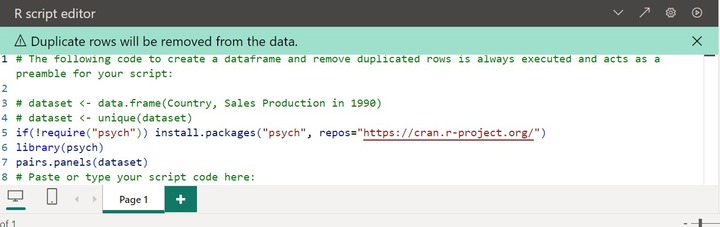
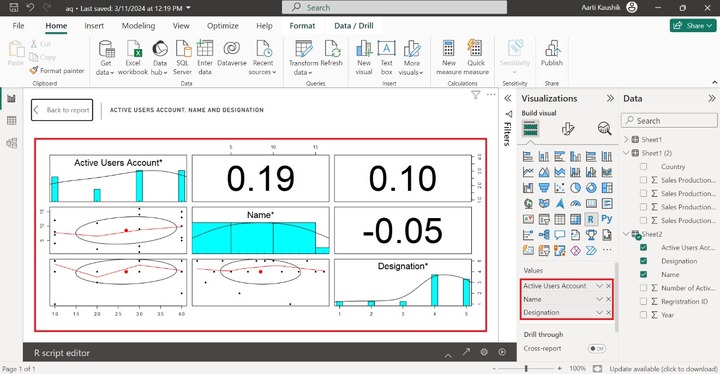
You can place the "Active Users Account", "Name" and Designation into the "Values" section from the Data pane. After placing the fields into the Values section. You need to write the following code in the R script and then click on "Run".
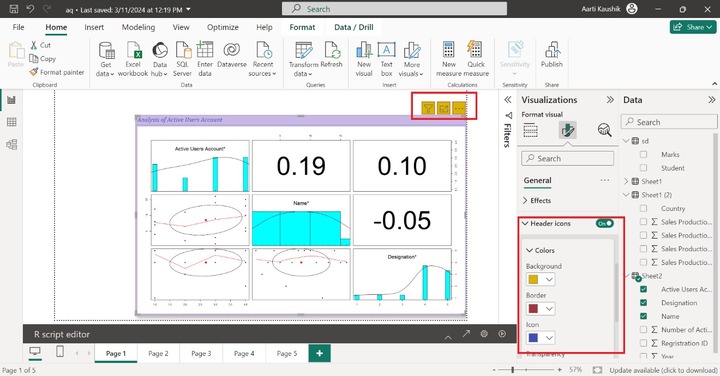
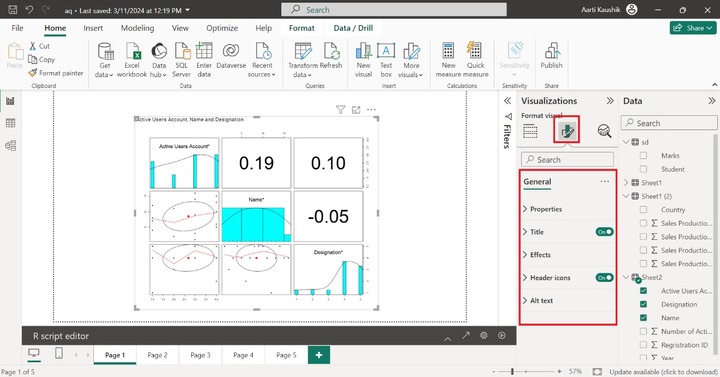
As you can see in the screenshot, the interactive visual that depicts an Active users account with its name and designation is populated on the canvas through R visual.
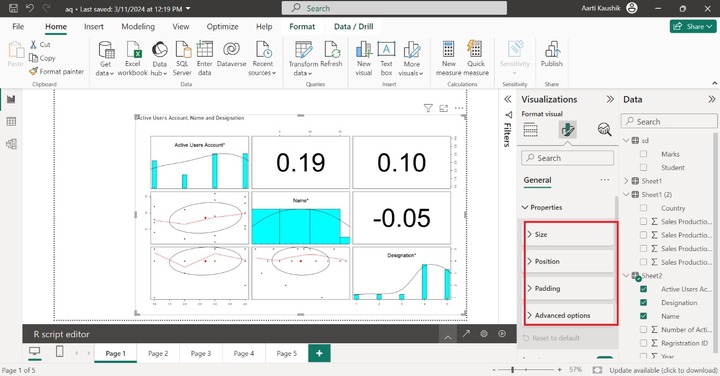
Formatting R Visual
The following sections like "Properties, Titles, Effects, Header icons, Alt text" are available under "Format Visual".

The properties sections comprise Size, Position, Padding, and Advanced options.
You may expand the Size tile and set the Height to 623 and width to 1030.
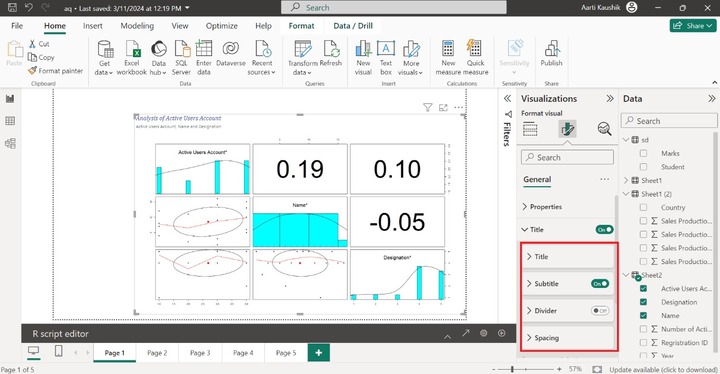
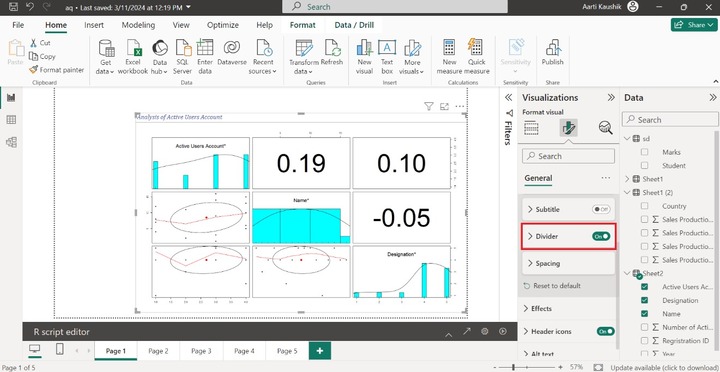
You may expand the "Title" that consists of the "Title", "Subtitle", "Divider" and spacing options.
You may expand the "Title" and enter the "Analysis of the Active user's Account" under "Text", select Heading 5, click on the "Italics", change the Font style to "Cambria" and increase the font size to 15. You may also the alter title text color under the "Text color".
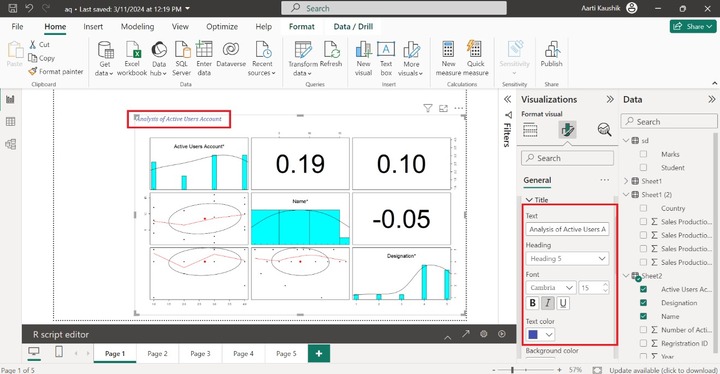
As you can observe in the screenshot, the formatting of the Title has been altered.
Similarly, you can customize the subtitle of the visual also. To do this, just expand the "Subtitle", select "Heading 6" from the given list under "Heading", change the font style to "Trebuchet MS" and increase the font size to 12. Select Italics and choose the desired color "D9B300" from the drop-down list.
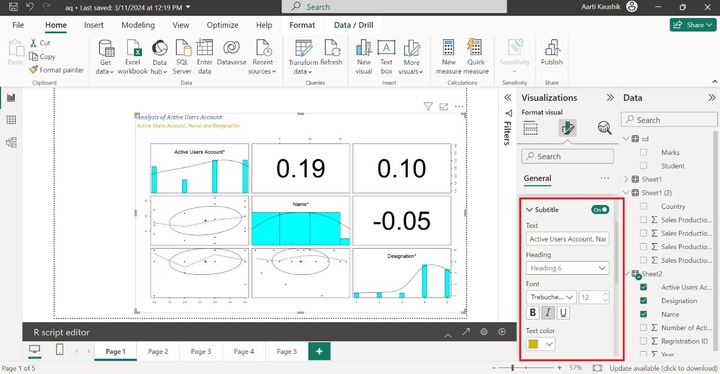
You may also turn on the "Divider" button to partition the title with the rest of the visual part.
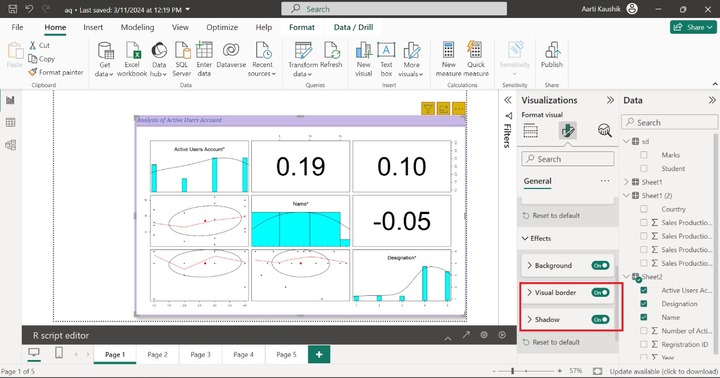
You can further click on the "Effects" comprising Background, Visual border, and shadow options.

You may expand the "Background" and select the "c7b8e7" color from the drop-down menu under the Color.
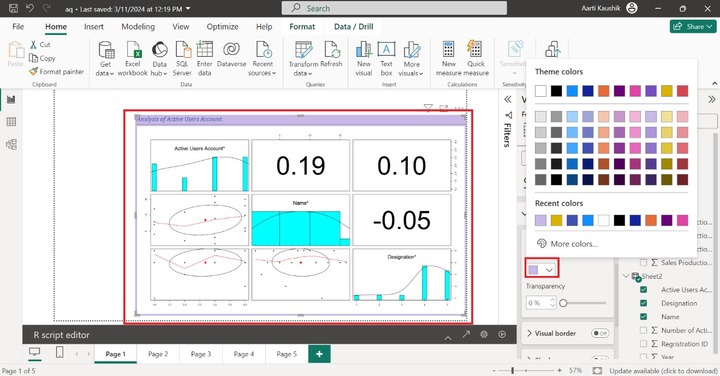
Therefore, the background of the R script-generated visuals has been changed.

You can also turn on the Visual border and Shadow toggle button to highlight the boundary and shadow of the designated visual.
You may click on the "Header icons" and expand the Colors tile to change the desired Background color, Border color, and Icon color as shown below −