- SciPy - Home
- SciPy - Introduction
- SciPy - Environment Setup
- SciPy - Basic Functionality
- SciPy - Relationship with NumPy
- SciPy Clusters
- SciPy - Clusters
- SciPy - Hierarchical Clustering
- SciPy - K-means Clustering
- SciPy - Distance Metrics
- SciPy Constants
- SciPy - Constants
- SciPy - Mathematical Constants
- SciPy - Physical Constants
- SciPy - Unit Conversion
- SciPy - Astronomical Constants
- SciPy - Fourier Transforms
- SciPy - FFTpack
- SciPy - Discrete Fourier Transform (DFT)
- SciPy - Fast Fourier Transform (FFT)
- SciPy Integration Equations
- SciPy - Integrate Module
- SciPy - Single Integration
- SciPy - Double Integration
- SciPy - Triple Integration
- SciPy - Multiple Integration
- SciPy Differential Equations
- SciPy - Differential Equations
- SciPy - Integration of Stochastic Differential Equations
- SciPy - Integration of Ordinary Differential Equations
- SciPy - Discontinuous Functions
- SciPy - Oscillatory Functions
- SciPy - Partial Differential Equations
- SciPy Interpolation
- SciPy - Interpolate
- SciPy - Linear 1-D Interpolation
- SciPy - Polynomial 1-D Interpolation
- SciPy - Spline 1-D Interpolation
- SciPy - Grid Data Multi-Dimensional Interpolation
- SciPy - RBF Multi-Dimensional Interpolation
- SciPy - Polynomial & Spline Interpolation
- SciPy Curve Fitting
- SciPy - Curve Fitting
- SciPy - Linear Curve Fitting
- SciPy - Non-Linear Curve Fitting
- SciPy - Input & Output
- SciPy - Input & Output
- SciPy - Reading & Writing Files
- SciPy - Working with Different File Formats
- SciPy - Efficient Data Storage with HDF5
- SciPy - Data Serialization
- SciPy Linear Algebra
- SciPy - Linalg
- SciPy - Matrix Creation & Basic Operations
- SciPy - Matrix LU Decomposition
- SciPy - Matrix QU Decomposition
- SciPy - Singular Value Decomposition
- SciPy - Cholesky Decomposition
- SciPy - Solving Linear Systems
- SciPy - Eigenvalues & Eigenvectors
- SciPy Image Processing
- SciPy - Ndimage
- SciPy - Reading & Writing Images
- SciPy - Image Transformation
- SciPy - Filtering & Edge Detection
- SciPy - Top Hat Filters
- SciPy - Morphological Filters
- SciPy - Low Pass Filters
- SciPy - High Pass Filters
- SciPy - Bilateral Filter
- SciPy - Median Filter
- SciPy - Non - Linear Filters in Image Processing
- SciPy - High Boost Filter
- SciPy - Laplacian Filter
- SciPy - Morphological Operations
- SciPy - Image Segmentation
- SciPy - Thresholding in Image Segmentation
- SciPy - Region-Based Segmentation
- SciPy - Connected Component Labeling
- SciPy Optimize
- SciPy - Optimize
- SciPy - Special Matrices & Functions
- SciPy - Unconstrained Optimization
- SciPy - Constrained Optimization
- SciPy - Matrix Norms
- SciPy - Sparse Matrix
- SciPy - Frobenius Norm
- SciPy - Spectral Norm
- SciPy Condition Numbers
- SciPy - Condition Numbers
- SciPy - Linear Least Squares
- SciPy - Non-Linear Least Squares
- SciPy - Finding Roots of Scalar Functions
- SciPy - Finding Roots of Multivariate Functions
- SciPy - Signal Processing
- SciPy - Signal Filtering & Smoothing
- SciPy - Short-Time Fourier Transform
- SciPy - Wavelet Transform
- SciPy - Continuous Wavelet Transform
- SciPy - Discrete Wavelet Transform
- SciPy - Wavelet Packet Transform
- SciPy - Multi-Resolution Analysis
- SciPy - Stationary Wavelet Transform
- SciPy - Statistical Functions
- SciPy - Stats
- SciPy - Descriptive Statistics
- SciPy - Continuous Probability Distributions
- SciPy - Discrete Probability Distributions
- SciPy - Statistical Tests & Inference
- SciPy - Generating Random Samples
- SciPy - Kaplan-Meier Estimator Survival Analysis
- SciPy - Cox Proportional Hazards Model Survival Analysis
- SciPy Spatial Data
- SciPy - Spatial
- SciPy - Special Functions
- SciPy - Special Package
- SciPy Advanced Topics
- SciPy - CSGraph
- SciPy - ODR
- SciPy Useful Resources
- SciPy - Reference
- SciPy - Quick Guide
- SciPy - Cheatsheet
- SciPy - Useful Resources
- SciPy - Discussion
SciPy - signal.remez() Function
scipy.signal.remez() is a function in SciPy's signal processing module that designs optimal Finite Impulse Response (FIR) filters using the Parks-McClellan algorithm. This method minimizes the maximum error between the desired and actual frequency responses which resulting in an equiripple filter.
This function is useful for designing low-pass, high-pass, band-pass and band-stop filters with precise control over the passband and stopband characteristics.
Syntax
The syntax for the scipy.signal.remez() function is as follows −
scipy.signal.remez(numtaps, bands, desired, weight=None, Hz=None, type='bandpass', maxiter=25, grid_density=16)
Parameters
Here are the parameters of the scipy.signal.remez() function used for designing FIR filters −
- numtaps: The number of filter coefficients (taps). Must be an odd number.
- bands: A sequence specifying the frequency bands. Frequencies should be in increasing order.
- desired: A sequence specifying the desired gain in each frequency band.
- weight (optional): A sequence of weights applied to each band to control the approximation error.
- Hz (optional): Sampling frequency in Hz. Default value is None which assumes the Nyquist frequency is 1.
- type (optional): The type of filter, either 'bandpass', 'differentiator' or 'hilbert'. Default value is 'bandpass'.
- maxiter (optional): The maximum number of iterations during optimization. Default value is 25.
- grid_density (optional): The density of the frequency grid used for optimization. Default value is 16.
Return Value
The scipy.signal.remez() function returns a 1D array of FIR filter coefficients that can be used for filtering.
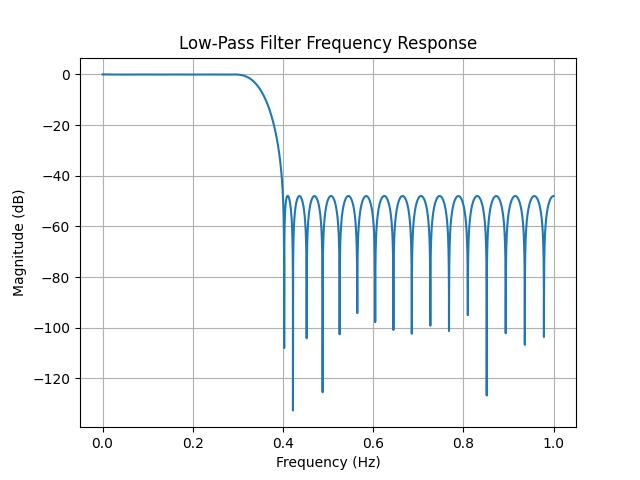
Designing a Low-Pass Filter
A low-pass filter allows low-frequency signals to pass while attenuating higher frequencies. It is commonly used to remove high-frequency noise from a signal. The scipy.signal.remez() function provides an efficient way to design such filters using the Parks-McClellan algorithm.
Here is an example of designing a low-pass FIR filter using the scipy.signal.remez() function −
import numpy as np
from scipy.signal import remez, freqz
import matplotlib.pyplot as plt

# Define sampling frequency
fs = 2.0  # Sampling frequency

# Design a low-pass filter
numtaps = 51
bands = [0, 0.3, 0.4, 1.0]  # Normalized frequencies (0 to fs/2)
desired = [1, 0]  # Passband and stopband gains

# Design FIR filter with explicit fs parameter
coefficients = remez(numtaps, bands, desired, fs=fs)

# Frequency response
w, h = freqz(coefficients, worN=8000, fs=fs)

# Plot the frequency response
plt.plot(w, 20 * np.log10(abs(h)))
plt.title('Low-Pass Filter Frequency Response')
plt.xlabel('Frequency (Hz)')
plt.ylabel('Magnitude (dB)')
plt.grid()
plt.show()
Below is the output of designing a low-pass filter using scipy.signal.remez() function −
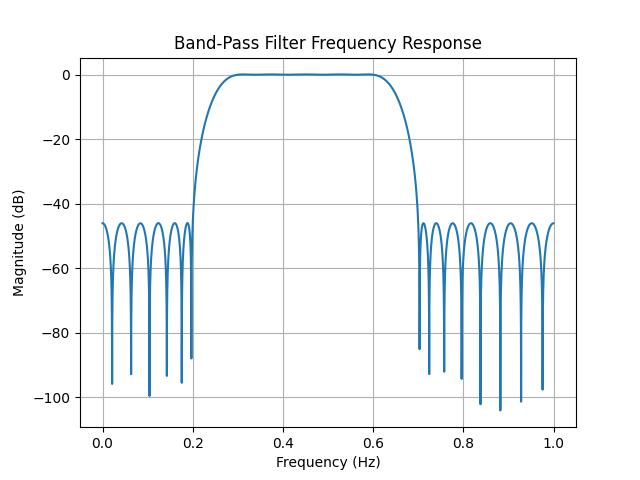
Designing a Band-Pass Filter
A band-pass filter allows frequencies within a specified range to pass while attenuating frequencies outside the range. Here is an example of designing a band-pass FIR filter using scipy.signal.remez() function −
import numpy as np
from scipy.signal import remez, freqz
import matplotlib.pyplot as plt

# Parameters
numtaps = 51
fs = 2.0  # Sampling frequency (normalize between 0 and fs/2)
bands = [0, 0.2, 0.3, 0.6, 0.7, 1.0]  # Normalized frequencies
desired = [0, 1, 0]  # Stopband, passband, stopband

# Design the band-pass filter with the specified sampling frequency
coefficients = remez(numtaps, bands, desired, fs=fs)

# Frequency response
w, h = freqz(coefficients, worN=8000, fs=fs)

# Plot the frequency response
plt.plot(w, 20 * np.log10(abs(h)))
plt.title('Band-Pass Filter Frequency Response')
plt.xlabel('Frequency (Hz)')
plt.ylabel('Magnitude (dB)')
plt.grid()
plt.show()
Following is the output of designing a band-pass filter using scipy.signal.remez() function −
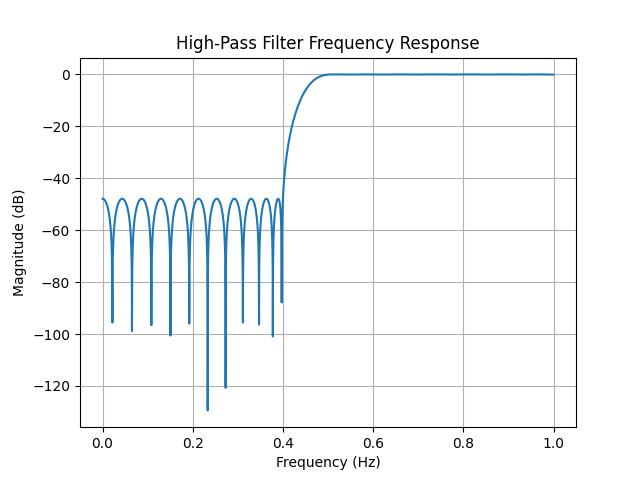
Designing a High-Pass Filter
A high-pass filter allows frequencies above a specified cutoff frequency to pass while attenuating frequencies below. Here is an example of designing a high-pass FIR filter using scipy.signal.remez() function −
import numpy as np
from scipy.signal import remez, freqz
import matplotlib.pyplot as plt

# Parameters
numtaps = 51  # Number of filter taps (coefficients)
fs = 2.0      # Sampling frequency (normalize between 0 and fs/2)
bands = [0, 0.4, 0.5, 1.0]  # Normalized band edges (relative to Nyquist)
desired = [0, 1]  # Desired gain for stopband (0) and passband (1)

# Design the high-pass filter
coefficients = remez(numtaps, bands, desired, fs=fs)

# Frequency response
w, h = freqz(coefficients, worN=8000, fs=fs)

# Plot the frequency response
plt.plot(w, 20 * np.log10(abs(h)))
plt.title('High-Pass Filter Frequency Response')
plt.xlabel('Frequency (Hz)')
plt.ylabel('Magnitude (dB)')
plt.grid()
plt.show()
Here is the output of designing a high-pass filter using scipy.signal.remez() function −